Section 1. Post-Season Highlights
Table of Contents
- Section 1. Post-Season Highlights
- Section 2. Introduction/Overview
- Section 3. Review Of Observed Arctic 2018 Conditions
- Section 4. Review Of The 2018 Sea Ice Outlooks
- Section 4a. Overview of the 2018 Sea Ice Outlook (SIO)
- Section 4b. Review of Statistical Methods
- Section 4c. Review of Dynamical Models and Methods of Forecast Initialization
- Section 4d. Spatial Forecasts of September Sea Ice Extent Probability (SIP)
- Section 4e. Review of Regional Alaska Forecasts
- Section 5. Further Analysis
- Section 5a. Probabilistic Assessment of the 2008-2018 Outlooks and Evaluation of SIO Forecast Skill Relative to Control Forecasts
- Section 5b. Discussion of Spatial 2018 Ice Advance
- Section 6. Antarctic Contributions
- Section 7. Sea Ice Drift Forecast Experiment (Sidfex) Results
- Section 8. Sea Ice Forecasts For The Alaska Marine Shipping Industry
- Section 9. Thoughts From The 2018 Sio
- Report Credits
- References
The Sea Ice Outlook (SIO) is a community network activity led by the Sea Ice Prediction Network-Phase 2 (SIPN2) Project Team with contributions from key partners. SIPN2 is a community of scientists and stakeholders with the goal of advancing our understanding of the state and evolution of Arctic sea ice cover. This SIO 2018 Full Post-Season Report centers around forecasts of pan-Arctic September minimum sea ice extent, while also including information about forecasts of sea ice probability and a synthesis of observed Arctic conditions from June to September 2018. This report also includes a review of forecasts for the Alaskan sector; an evaluation of the SIO forecast skill; discussions about Antarctic maxima sea ice extent forecasts; the Sea Ice Drift Forecast Experiment; an overview of sea ice forecasting needs of the Alaska marine shipping industry; and ideas of how to continue efforts to understand sea ice predictability and how to create information products that are accessible to stakeholders so that the science can be used in decision making to improve outcomes.
2018 Submissions: This year we received a total of 112 submissions for pan-Arctic September extent, with 34 received in June, 39 in July, and 37 in August. We collected Alaska regional forecasts (the combined Chukchi, Bering, and Beaufort seas) for the third year in a row and for a second year we included forecasts of the Antarctic maxima. We thank all our participants in the SIO!
Observed and Predicted Extent: According to the National Snow and Ice Data Center's (NSIDC) Sea Ice Index, the 2018 September monthly mean sea ice extent was 4.71 million square kilometers, which ties with 2008 for the 6th lowest in the satellite record. The minimum extent was reached twice, on 19 and 23 September, both of which were later than the median minimum date of 14 September, and 23 September was tied with 1997 for the latest minimum in the satellite record. The medians of the SIO contributions for June, July, and August were 4.60, 4.70, and 4.57 million square kilometers, respectively. The July ensemble Outlook was nearly perfect in terms of the total observed extent of 4.71 million square kilometers as reported by the NSIDC (please note: The NSIDC monthly mean sea ice extent is the average of all the daily sea ice extent values).
Methods: This year we received a total of 52 statistical forecasts, 42 dynamical, 12 heuristic, and 6 using mixed methods. In comparing the different methods, dynamic models (i.e., coupled ice-ocean and ice-ocean-atmosphere models) performed well overall, and in outlooks from statistical methods, the median of July contributions was very close to observations. Mixed and heuristic methods had a limited number of contributions, making assessments more difficult. This report contains discussion on the different Outlook prediction methods used, as well as September sea ice extent probability and a review of regional forecasts of the Alaskan sector.
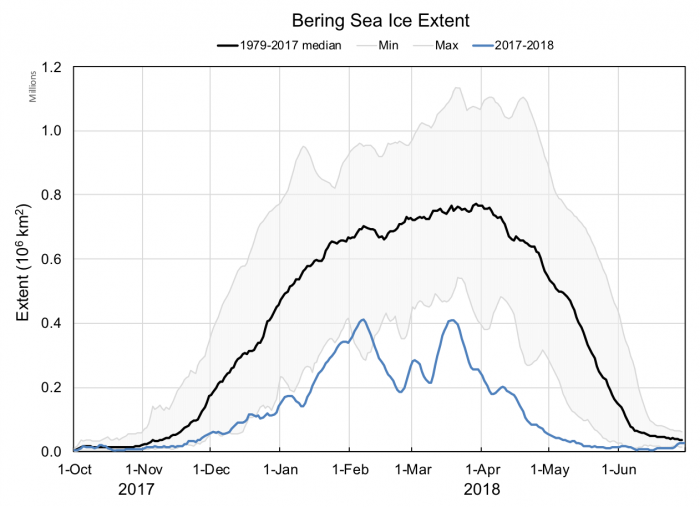
Observed 2018 Arctic Conditions: In 2018, Arctic ice extent reached record lows during the first half of the year, with the lowest recorded extent in both January and February and second lowest from March to May. The low May extent was due in large part to the lack of ice in the Bering Sea, where 2018 was the lowest on record for nearly all of 2018. Sea ice in the Beaufort Sea on the north coast of Alaska persisted in July and into August, slowing down the summer retreat. Sea surface temperatures in summer 2018 were quite high, especially in the Chukchi and eastern Laptev seas. Summer air temperatures (approximately 2,500 feet above the surface) were above average over the Arctic Ocean and Eurasia, and were below average over coastal North America. 2018 Arctic air temperatures in August were above July temperatures—a first in the observed record since 1979.
Thoughts From the 2018 Sea Ice Outlook: The SIO 2018 Post Season Report attempted to bring together more sources of information and analysis than we have in the past to enhance our understanding of the predictability of sea ice. What started out as a record low winter did not result in a record September minimum. Ideas are provided below on how to improve our understanding of sea ice predictability and how to create information products that are accessible to the stakeholder so that the science can be used in decision making to improve outcomes.
Section 2. Introduction/Overview
This Sea Ice Outlook (SIO) Post-Season Report of the Sea Ice Prediction Network-Phase 2 (SIPN2) centers around forecasts of pan-Arctic September minimum sea ice extent, while also including spatial sea ice forecast information and a synthesis of observed Arctic conditions from June to September 2018. SIPN2 is a community of scientists and stakeholders with the goal of advancing our understanding of the state and evolution of Arctic sea ice cover. The SIO is a community network activity that is led by the SIPN2 project team with contributions from key partners and the community.
We heartily thank the participants who contributed to the 2018 SIO to make it the year with the greatest number of contributions for all categories. This year we received a total of 112 submissions of pan-Arctic (full field) September extent forecasts, with 34 in June, 39 in July, and 39 in August. The full field analysis was significantly advanced this year by the SIPN sea ice forecast data portal that continuously collects forecasts, expanding the forecasts to other seasons beyond the September minimum. The portal now provides access to datasets and the means to perform analysis using a Jupyterhub. Starting in 2016, SIPN has also been collecting forecasts of the extent in the combined Chukchi, Bering, and Beaufort seas, which are referred to as the "Alaskan Region." Participation in Alaska regional evaluation continues to increase each year, and for the 2018 SIO we received 11 contributions in each of the months of June, July, and August. SIPN2 has a component that focuses on evaluating the economic value of sea ice forecasts to stakeholders, in particular the Alaska marine shipping industry. This new component is briefly discussed in this report. Other new topics covered in this 2018 SIO Post-Season Report include: ocean heat content, spatial patterns of ice advance, and an expanded discussion of the Sea Ice Drift Forecast Experiment (SIDFEx). The report also includes sections on observed Arctic conditions, a review and discussion of SIO forecasts, Antarctic contributions, and lessons learned in 2018.
Section 3. Review of Observed Arctic 2018 Conditions
Section 3a. Observed Arctic Sea Ice
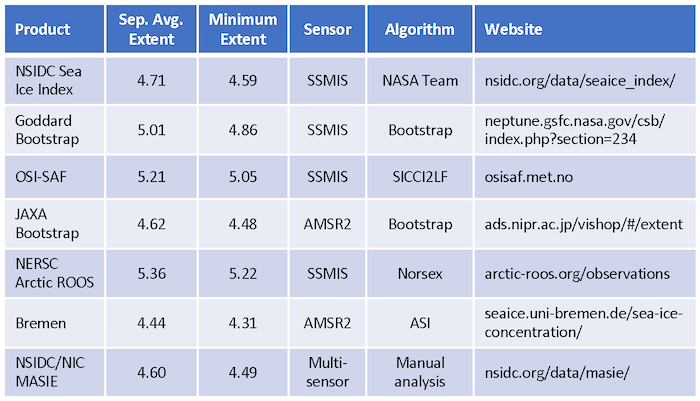
The 2018 September monthly mean sea ice extent of 4.71 million square kilometers according to the National Snow and Ice Data Center's (NSIDC) Sea Ice Index (SII) is tied with 2008 for the 6th lowest in the satellite record that began in 1979. The September linear trend through 2018 is now -82,300 square kilometers per year (12.8% per decade, relative to the 1981–2010 average) (Figure 3.1). The absolute minimum extent (based on a 5-day running average) was 4.59 million square kilometers according to the SII; which was also tied for the 6th lowest with 2008 and 2010. The minimum extent was reached twice, on September 19 and 23, which was later than the median minimum date of September 14. September 23 tied with 1997 for the latest minimum in the satellite record.

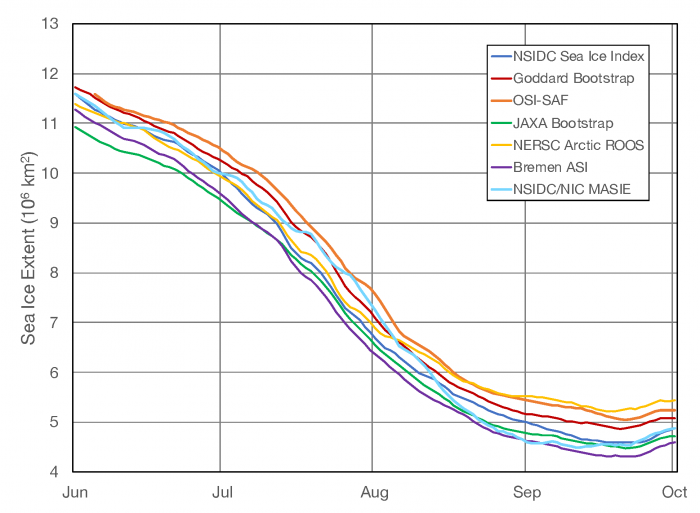
Several organizations now estimate sea ice extent from a variety of sources, most based on passive microwave satellite imagery. Differences in processing and data sources result in different extent values (Figure 3.2). However, these differences are generally offsets that are consistent for a given time of year, long-term trends and variability are in better agreement. Table 1 provides estimates of minimum and September average extent from selected sources.
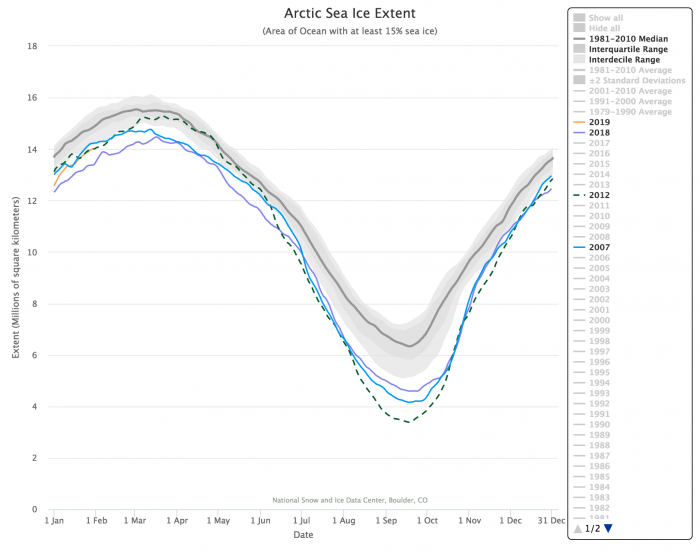
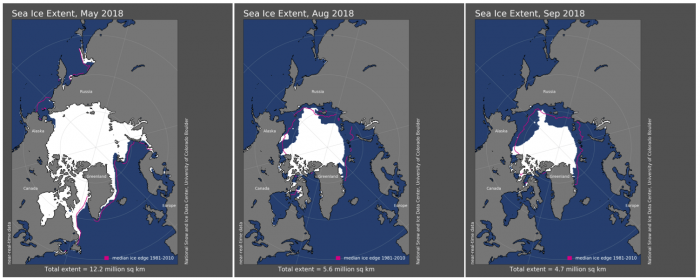
Arctic sea ice from January to April 2018 was lower than the corresponding months in 2012, the record minimum September ice extent (Figure 3.3). In 2018, Arctic ice extent reached record lows during the first half of the year, with a rank of first lowest in January and February and second lowest from March to May. The sea ice extent retreat during June and July was similar to 2012 and 2007, but was slower in August and September. Low May extent was due in large part to the lack of ice in the Bering Sea (Figure 3.4), where 2018 was the lowest on record for nearly all of 2018 (Figure 3.5). Sea ice in the Beaufort Sea on the north coast of Alaska persisted in July and into August slowing down the summer retreat (Figure 3.3). September sea ice extent in the Canadian (or eastern) Beaufort was also above normal (Figure 3.4). Sea ice extent in August and September had retreated well below the climatological median throughout the Arctic with the exception of the Laptev Sea (Figure 3.4).
Section 3b. Ocean Heat
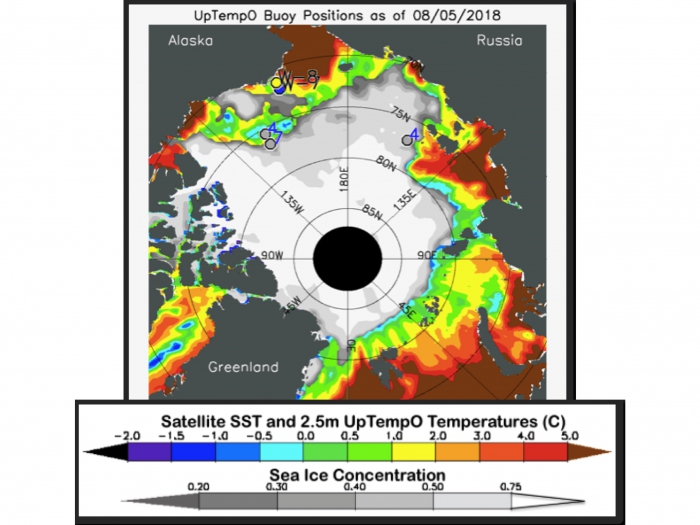
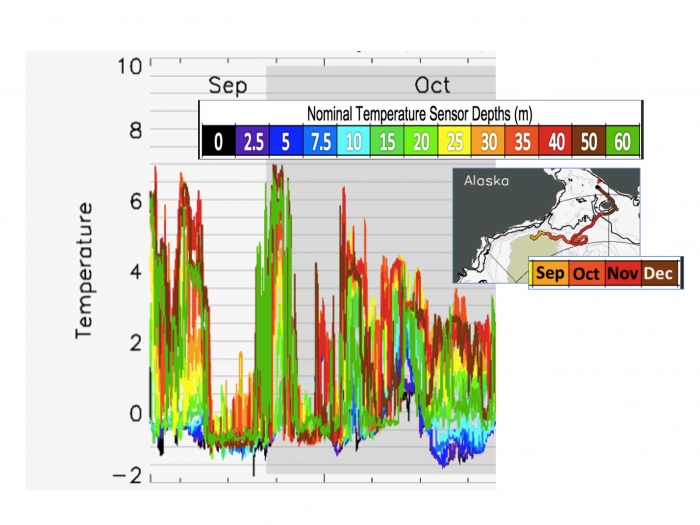
Sea surface temperatures (SSTs) in summer 2018 were quite high, especially in the Chukchi and eastern Laptev seas. The Chukchi Sea warming started relatively early in the season (i.e., in May), partly in response to northward warm ocean advection from the unusually ice-free Bering Sea of winter 2017-2018. Laptev Sea warming was strong but matched by some previous years (e.g., 2011) and did not start unusually early. Figure 3.6 shows conditions in early August, when a large patch of ice remained north of Alaska, separate from the main pack. This area is often the last to melt along the North American Arctic coast (Steele et al., 2015), leading to cool temperatures by the end of summer (Steele and Dickinson, 2016). The northern Chukchi Sea was quite warm by early August; drifting WARM buoys measured surface temperatures above 6°C. In September, an UpTempO buoy deployed to the west (i.e., along 150W north of Alaska) found similar warm temperatures at 40–60 m depth, below the ice-patch-cooled surface layer. This was confirmed by ship observations carried out on the research vessel, Sikuliaq, as part of the Office of Naval Research (ONR) Stratified Ocean Dynamics in the Arctic (SODA) program. The UpTempO buoy drift crossed several alternating streams of warm and cool water in the southwestern Beaufort Sea (Figure 3.7), indicating a patchiness of subducting warm Pacific water coming from the Chukchi Sea. After the sea ice minimum, SSTs cooled at a pace comparable to previous years; by November ocean heat content in the Chukchi and Laptev "warm spots" was similar to that found in previous years. This indicates that the timing of sea ice advance depends on both end-of-summer ocean heat as well as fall atmospheric conditions that dictate air-sea heat fluxes.
Section 3c. Atmospheric Conditions
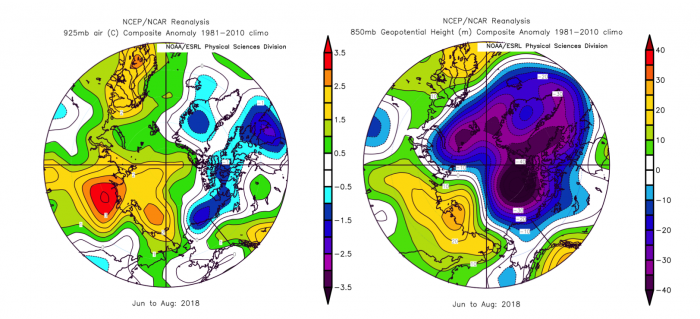
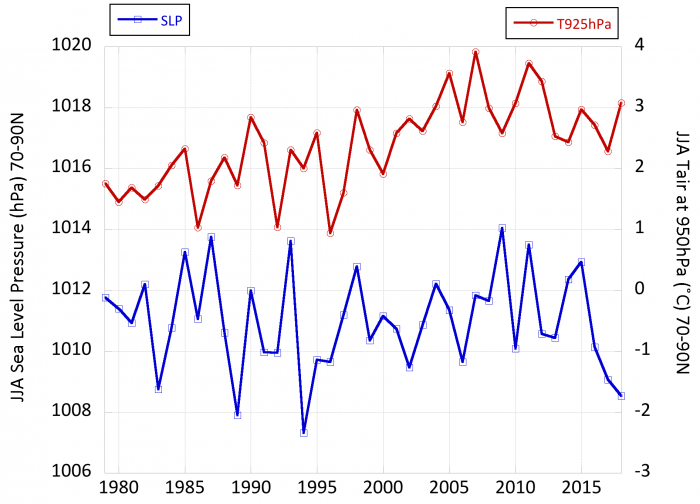
Summer (June–August) 925-hPa air temperatures (approximately 2,500 feet above the surface) were above average over the Arctic Ocean and Eurasia and were below average over coastal North America (Figure 3.8, left panel). The 850-hPa geopotential height (Figure 3.8, right panel) was anomalously low over the central Arctic Ocean, North America, and the Atlantic sector of the Arctic. Heights were above average over much of northern Eurasia. Seasonal anomalies in sea level pressure were similar to those of 850-hPa geopotential height. The June–August SLP pattern in 2016 and 2017 featured anomalously low average pressure centered over the Arctic Ocean whereas in 2018 there were two low pressure centers, one in the Barents Sea and one closer to the Canadian Arctic Archipelago. Seasonal 925-hPa temperature averaged from 70–90 degrees N over the 1979–2018 period shows an increase in temperature starting in 1997 peaking around 2007 and declining until 2018. Temperatures in 2018 rank as the 6th warmest over the 1979–2018 period (Figure 3.9). Seasonal SLP for 2018 for this region ranked at the 3rd lowest and was lower than for the past two years (Figure 3.9). One interesting feature of the summer was the variability between months. July was a cool month, while June and particularly August were warm. August 925 mb temperatures were actually higher than July, something not seen in the past 40 years (Figure 3.10). Despite the summer variability and the warm August, given that the atmospheric seasonal temperatures were overall high but not extreme, they are broadly consistent with the ranking of sixth lowest sea ice minimum in 2018.

Summer conditions around northern Alaska were generally cooler than in the Eurasian Arctic. After an extremely early start to the melt season in the southern Chukchi Sea, summer ice melt near Alaska was much slower than recent years. June featured persistent cloudy and cool weather, slowing melt. July was milder with more storminess which increased ice melting, but it was not until August that melt really accelerated. Sea ice in the Beaufort remained close to the northern Alaska coast until late July. There was still considerable ice in the Beaufort Sea near the Alaskan coast, east of Cape Halkett by late August. The ice was sufficiently consolidated that non ice-hardened vessels had to wait for open channels to develop. The ice was well north of the Alaska coast in the Chukchi Sea at the end of August. Sea ice north of Alaska continued to melt back during September and did not reach the lowest extent of the season until the first week of October. Thereafter, sea ice increased in the Chukchi Sea but there was no appreciable ice anywhere in the Bering Sea until the first days of November. Although sea ice growth was faster in the Chukchi Sea during November 2018 than in November 2017, ice extent remained far below historical normal. The Bering Sea remained at or near record low ice extent due to the combination of significantly warmer than average ocean surface temperatures and a weather pattern that did not allow ice to set up and thicken.
Section 4. Review Of The 2018 Sea Ice Outlooks (SIO)
Section 4a. Overview of SIO
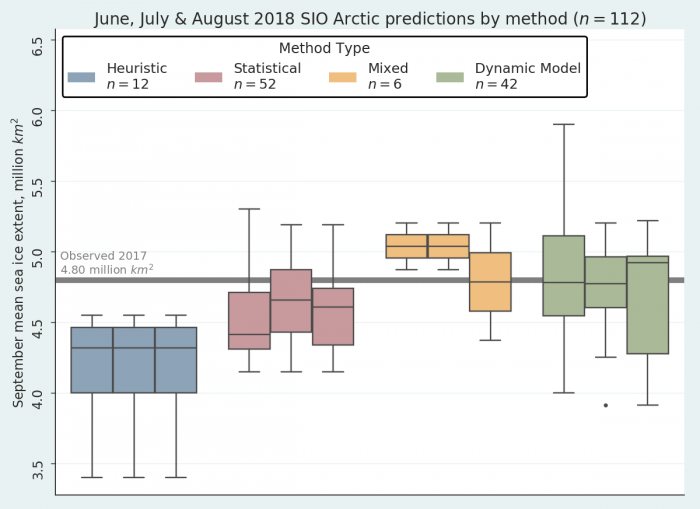
The medians of the Outlook contributions for June (Figure 4.1), July, and August were 4.60, 4.70, and 4.57 million square kilometers, respectively. Thus, the July ensemble Outlook was nearly perfect in terms of total observed extent (4.71 million square kilometers as reported by the NSIDC). The August median projection was lower than the observed September extent, likely due to an above average rate of ice loss during July; this caused contributors to revise their projections downward. However, as discussed further below, the August rate of decline was near average, which caused the observed September extent to diverge from the August projection. Regardless, the inter-quartile range of the projections of 4.4–4.9 million square kilometers bracketed the observed September extent. This fits a pattern noted before—outlooks perform well when the observed extent is near the trend line as it was this year (Figure 4.2). Outlier years tend to be more difficult to predict.
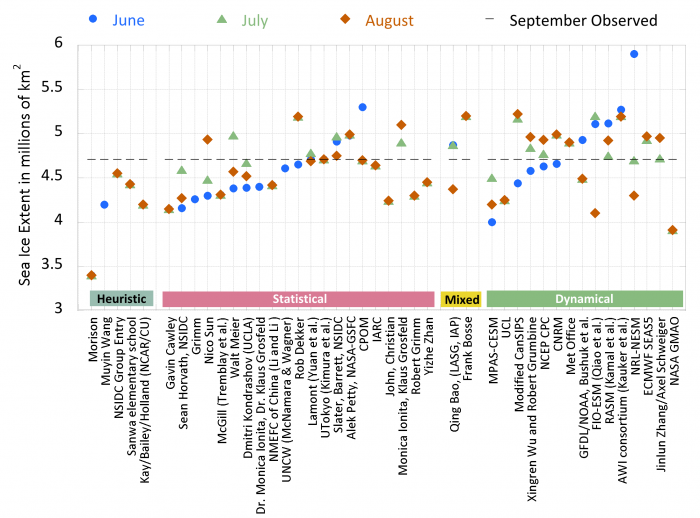
In comparing the different methods, dynamic models performed well overall, with the observed extent within the model inter-quartile range from all three Outlooks (June, July, August), though the July and June medians were closer to the observed extent than the August median (Figure 4.2). In outlooks from statistical methods, the median of July contributions was very close to observations and their inter-quartile range bracketed the observed extent. Mixed and heuristic methods had a limited number of contributions, making assessments more difficult. In general, mixed methods projected higher September ice extent than observed, while heuristic methods projected lower ice extent. Figure 4.3 shows additional details about how individual forecasts evolved over the season. The dynamical forecasts for all months were spread more evenly around the observed sea ice minimum (Figure 4.3), while the statistical forecasts had more realizations below the observed value. The dynamical methods performed slightly better than the statistical methods and the greater spread in the dynamical compared to the statistical suggest the dynamical provides slightly more accuracy at the expense of precision.

Section 4b. Review of Statistical Methods
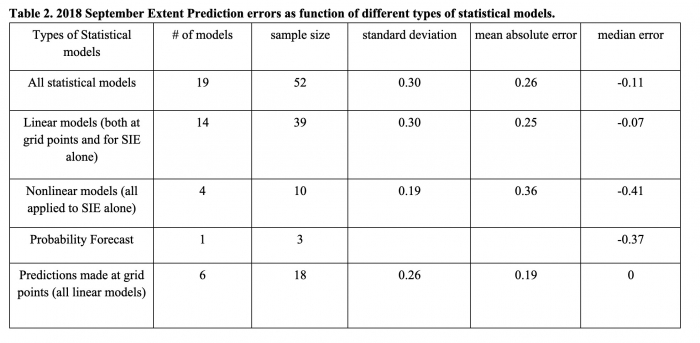
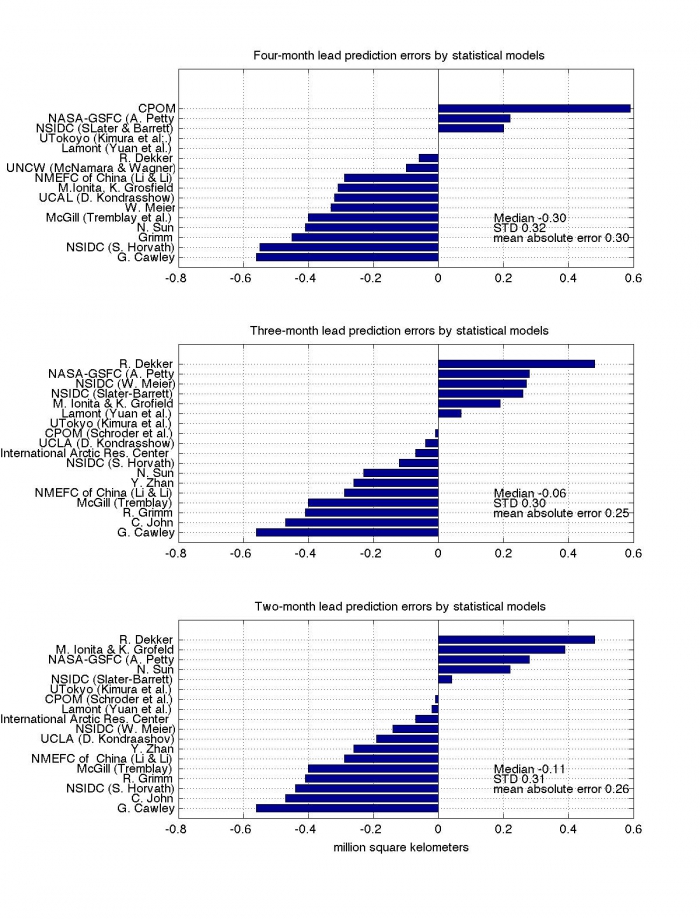
The averaged September sea-ice extent predicted by 19 statistical models is 4.52, 4.64, and 4.64, respectively for their June, July, and August forecast. A total of 52 September predictions were submitted in the 2018 summer season: 16 in June, 18 in July, and 18 in August. Figure 4.4 summarizes errors in predicted sea-ice extent at three lead times. They are based on linear models (14), nonlinear models (4), and a probability model (1). Statistical models have two characteristics that are fundamentally different from dynamic models. First, they can be developed with a single time series of sea-ice extent without spatial information on ice concentration. Second, they can be built to use monthly or yearly time series without integrating through small time steps. These two characteristics give statistical models a tremendous advantage on resource demands, compared to dynamic models. The standard deviation of the 52 predictions of September extent is 0.30 million square kilometers with a mean absolute error of 0.26 million square kilometers and a median error of -0.11million square kilometers (Table 2).
Among the 14 linear models, ten use atmospheric and/or oceanic variables as predictors. These include sea surface temperature, ocean heat content, surface air temperature, pressure fields, reflected solar radiation at the top of the atmosphere, melt ponds on sea ice, snow area on land, and sea ice concentration at various lead times. Four linear models only use sea ice information as predictors. Two models were initialized with ice thickness information.
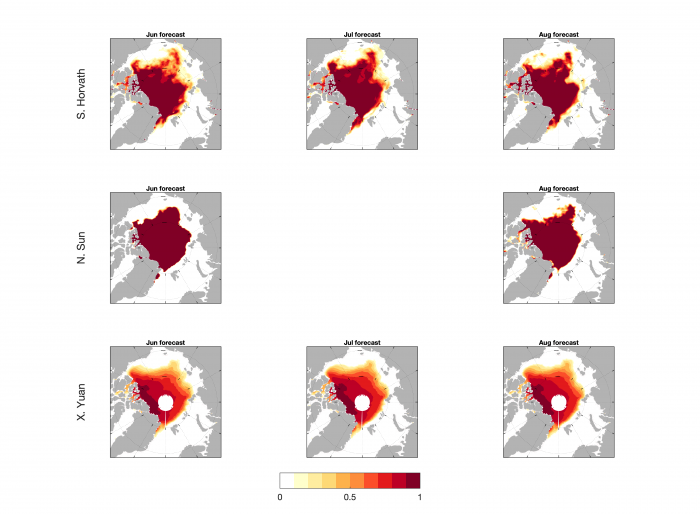
Most statistical models (13 out of 19) are designed to predict September extent without the knowledge of concentration evolving through space. Six models made concentration predictions at grid points (five linear models and one probability model) and then calculated extent, but only two groups provided predicted concentration maps (Figure 4.5). These six models yield standard deviation and mean absolute error in extent of 0.25 and 0.19 million square kilometers, respectively. The latter is the smallest mean absolution error in all types of prediction methods (see Figure 4.2 for the four categories of methods). Although the sample size is limited, the result suggests that the information on the spatial distribution of ice concentration is advantageous for predictions among statistical models.
All four nonlinear models use the extent time series alone. They all underestimate the September extent with the largest bias and mean absolute error among different types of statistical models, although the standard deviation is the smallest (Table 2). It appears that the linear models outperformed the nonlinear models in terms of the bias and the mean absolute error.
Section 4c. Review of Dynamical Models and Methods of Forecast Initialization
The mean September extent forecast from all dynamical models was 4.74+/-0.42 million square kilometers, with only slightly changing mean forecasts through the summer (mean dynamical model forecasts of 4.81, 4.75, and 4.69 million square kilometers in June, July, and August respectively (see Figure 4.2 in Section 4a above). The 2018 SIO forecasts from dynamical models are assessed based on their forecast initialization of sea-ice concentration and sea-ice thickness observations. Figure 4.6 shows the September extent forecasts throughout the summer from the models split by initialization: models that do not assimilate either extent or thickness, models that only assimilate concentration, and models that assimilate both concentration and thickness.
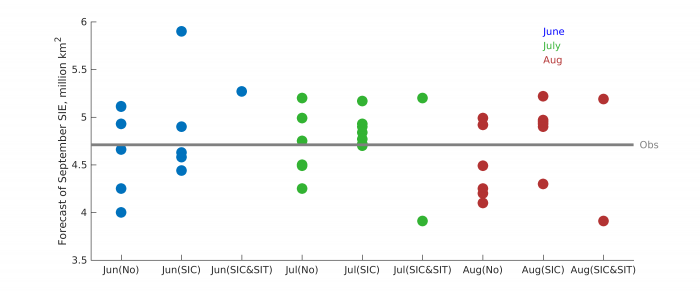
Most models either do not assimilate sea ice or only assimilate sea ice concentration (SIC) observations, and only two models assimilated both sea ice concentration and sea ice thickness (SIT). The mean extent across all summer forecasts is 4.62+/-0.4 million square kilometers (no assimilation), 4.88+/-0.34 million square kilometers (SIC assimilation), and 4.70+/-0.72 million square kilometers (SIC and SIT assimilation). Given the relatively small sample size, differences across the initializations should be interpreted with caution. Note the large spread in how models in the 'no' category initialize their ocean/sea ice components. For example, some models use output from ocean reanalysis and observed sea surface temperatures, which should give a realistic representation of the ice edge, while others use climate model output from historically forced runs that do not assimilate ocean information.
Section 4d. Spatial Forecasts of September Sea Ice Extent Probability (SIP)
As we have done since 2014, participants were invited to submit forecasts of sea-ice extent probability (SIP – forecast probability of concentration greater than 15%). This year we received a record number of extent probability forecasts: 10 in June, 14 in July, and 12 in August. Figure 4.7 shows the June forecast, with the observed September sea-ice extent edge overlain, together with the ensemble mean of individual models' SIP, and the model uncertainty in the SIP forecast (as represented by the standard deviation across the forecasts).
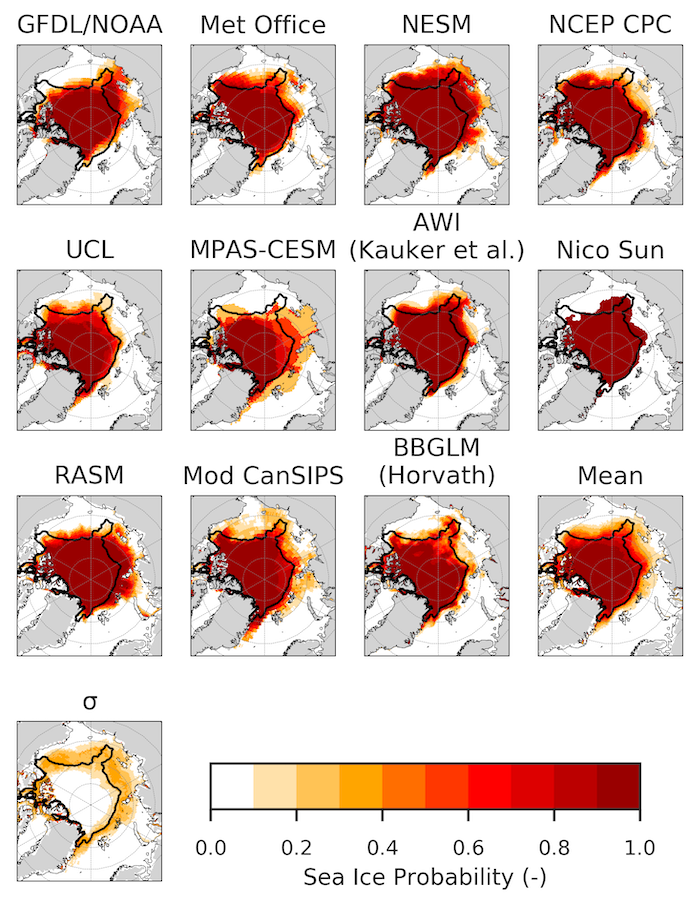
Overall, in 2018, models were more successful and consistent in their ice probability forecasts along the 'European' Arctic (Svalbard, Barents/Kara seas), and less so in the East Siberian and Beaufort seas. Interestingly, the observed sea ice edge lies almost entirely within the region of model uncertainty (bottom right panel), a positive result which indicates that overall the model ensemble is not consistently over-or-under predicting sea ice conditions.
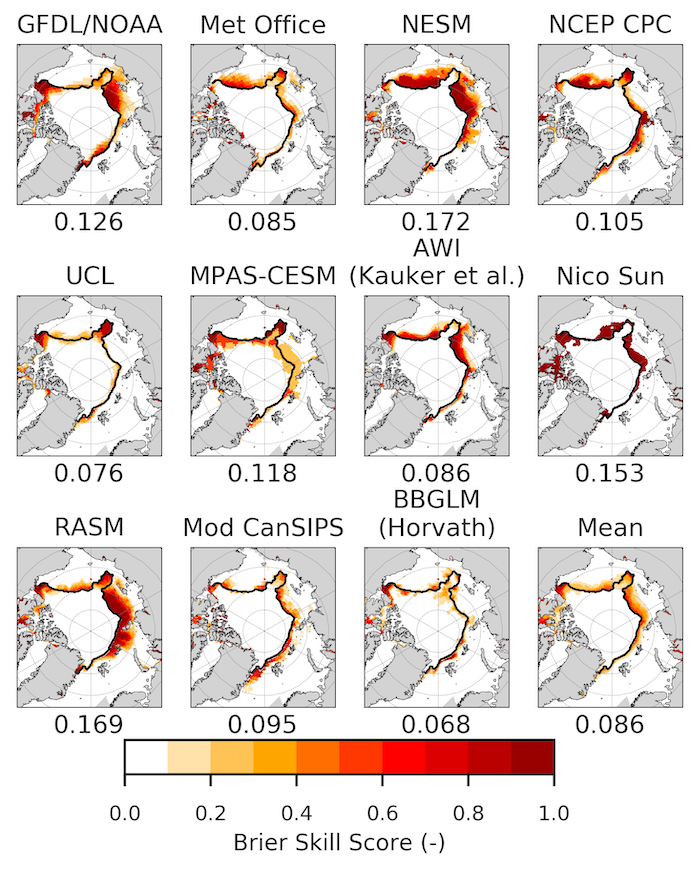
To quantify the skill of ice probability forecasts, Figure 4.8 shows the Brier scores (a metric constructed so that zero indicates a perfect forecast and 1 indicates an erroneous, or no skill, forecast) from each probability forecast and the multi-model mean. The value on the x-labels shows the pan-Arctic, spatially averaged Brier score (lower values indicate more accurate forecasts).
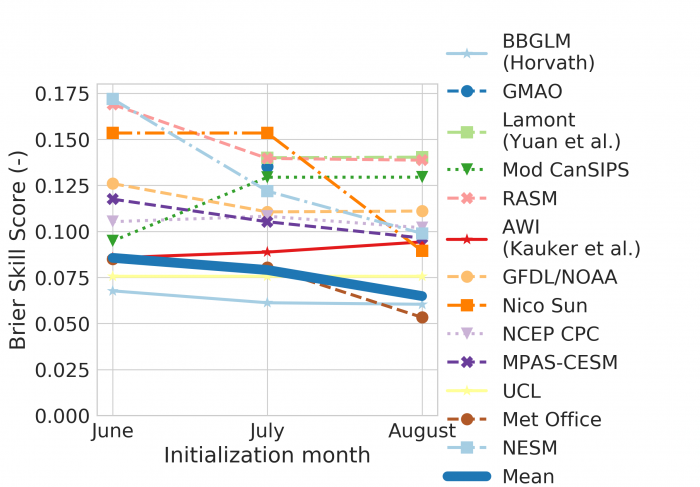
How did the sea ice probability forecast accuracy evolve from the June to the August outlooks? Figure 4.9 shows the spatial mean Brier scores for all model submissions and that of the model mean ice probability from June to August. Several interesting features arise. One, we see that there is generally little change from June to August, and the spread in Brier scores does not decrease (one would expect forecasts to converge with shortening forecast lead times resulting in reduced Brier score spread). Secondly, the multi-model forecast was not the best overall, as previously found (2017), but is still one of the best performing forecasts.
Section 4e. Review of Regional Alaska Forecasts
This year we again invited participants to optionally submit an estimate of the sea ice extent for the Alaskan region, defined here as the combination of the Bering, Chukchi, and Beaufort seas. Contributors were asked to take the boundaries for these seas from the NSIDC Arctic sea ice regional graph (for details, see the 2018 June calls for submissions). This year we received 11 forecasts in June, 12 in July, and 11 in August, a record number of regional Alaska contributions.
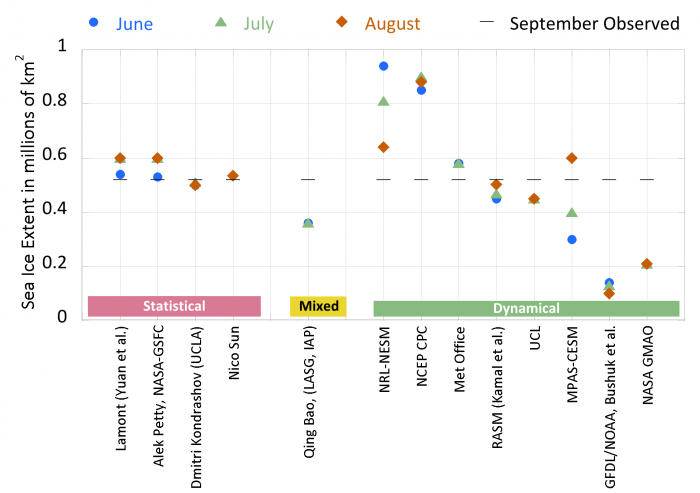
The observed 2018 September extent in the Alaska region was 0.52 million square kilometers, an increase from the past couple of years (0.32 million square kilometers in 2017 and 0.27 million square kilometers in 2016). Figure 4.10 shows a boxplot of Alaskan extent forecasts split by type (statistical, dynamical, and mixed forecast).
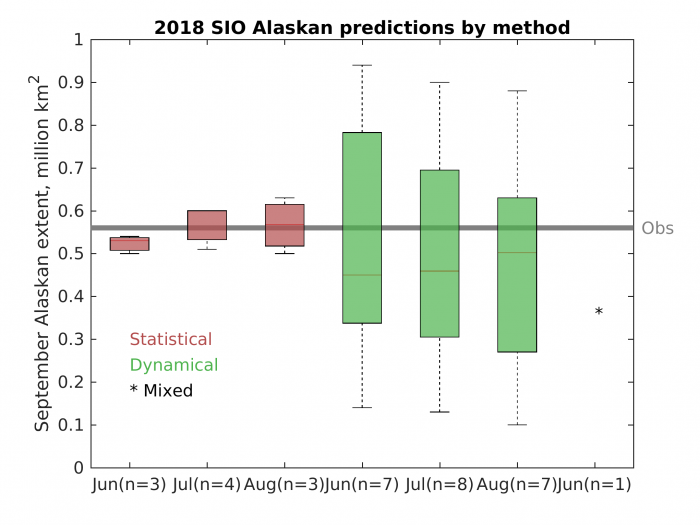
The statistical forecasts were very close to the observed value and to each other (small forecast spread), whereas the dynamical models as a whole slightly under-predicted Alaskan extent (model mean forecast = 0.50), but unlike statistical forecasts, showed a large spread across forecasts. Interestingly, we saw a very similar pattern in 2017 Alaskan forecasts. The evolution of each set of forecasts is shown in Figure 4.11.
Section 5. Further Analysis
Section 5a. Probabilistic Assessment of the 2008–2018 Outlooks and Evaluation of SIO Forecast Skill Relative to Control Forecasts
Key metrics of the skill of forecasts are the improvement (or reduction of error) relative to control forecasts. As in weather and climate forecasting, persistence (a prediction of the same ice extent as the preceding September) is a natural control forecast. Given the strong trend of September ice extent in recent decades, an additional control forecast is the simple extrapolation of the linear trend or other representation of the trend (e.g., quadratic fit to the post-1979 time series). Another control forecast is the trend-line anomaly persistence, which is a forecast that the departure from the trend line will be the same as the preceding September. The following is a summary of the 2018 SIO forecasts relative to these control forecasts of the 2018 September mean ice extent (millions km2):
| 2018 observed extent | 4.71 |
|---|---|
| June SIO median outlook | 4.60 |
| July SIO median outlook | 4.70 |
| August SIO median outlook | 4.57 |
| Persistence | 4.80 |
| Linear trend extrapolation | 4.45 |
| Quadratic trend extrapolation | 4.48 |
| Linear trend anomaly persistence | 4.73 |
It is apparent that the SIO median outlook generally outperformed the control forecasts in 2018, especially in the case of the July outlook. The most formidable competitor among the control forecasts was the linear trend anomaly persistence, which combines information from both the trend and persistence.
The September sea ice forecasts available from SIPN2 and its predecessors (SIPN1 and the Sea Ice Outlook) span 2008–2018, providing an 11-year sample for which the skill can be compared with the control forecasts listed above. Figure 5.1 summarizes the two skill metrics over the 11-year period (all numerical values are millions of square kilometers).
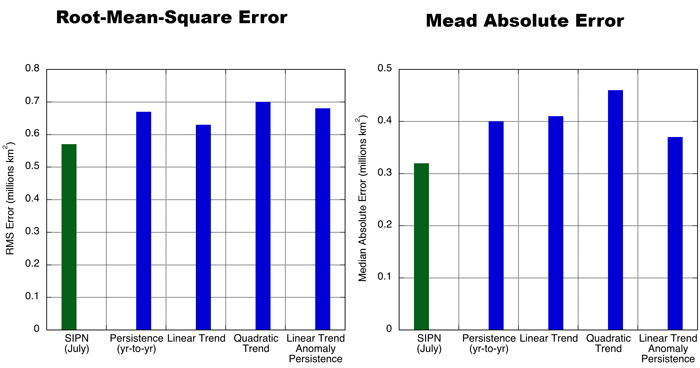
Over the 11-year sample, the SIO/SIPN forecasts have outperformed all the control forecasts. The improvement is modest: The reduction of error ranges from 10–19% for the root mean square error and 13%–30% for the median absolute error. Of the various control forecasts, those that utilize the linear trend generally have the smallest errors. In particular, consistent with its strong performance in 2018, the linear trend anomaly persistence has a median absolute error that is only 0.05 million square kilometers greater than the corresponding SIO/SIPN error.
It should be noted that all the control forecasts are available for the next year as soon as the current year's September ice extent is available. For example, the control forecast for September 2019 based on the linear trend anomaly persistence is 4.63 million square kilometers.
Section 5b. Discussion of Spatial 2018 Ice Advance
The 2018 early ice-growth (October) season was particularly slow, and in mid-October total Arctic sea ice extent (SIE) was tracking below all years except 2016. However, toward the end of the month, the pace of ice growth increased.
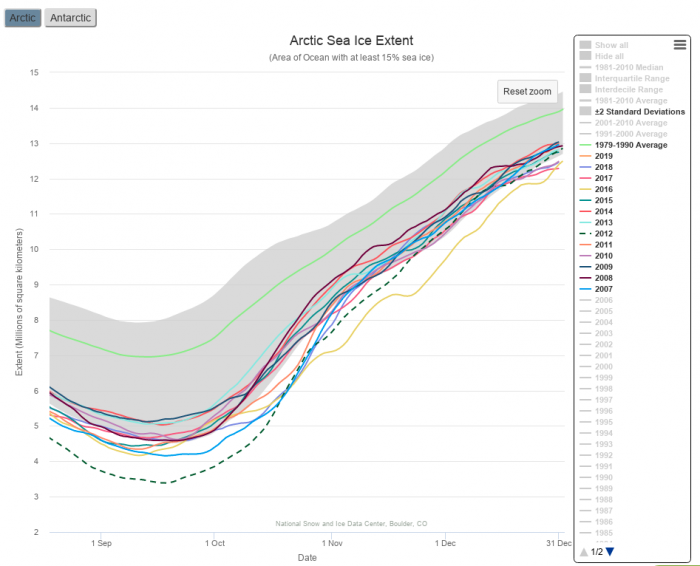
During October 2018, SIE was particularly low (a record) in the Laptev Sea and the Barents Sea. It is possible to test how predictable these conditions were by inspecting October forecasts obtained from the year-round SIPN sea ice forecast data portal. Figure 5.3 shows spatial 5-week forecasts of sea ice probability for late October. Models successfully forecasted the low sea ice conditions in the Laptev and Kara seas, unlike the climatology trend or damped trend forecasts. This suggests that the late sea ice growth was at least in part due to anomalous September ocean warmth (and thus predictable), rather than unpredictable atmospheric forcing.
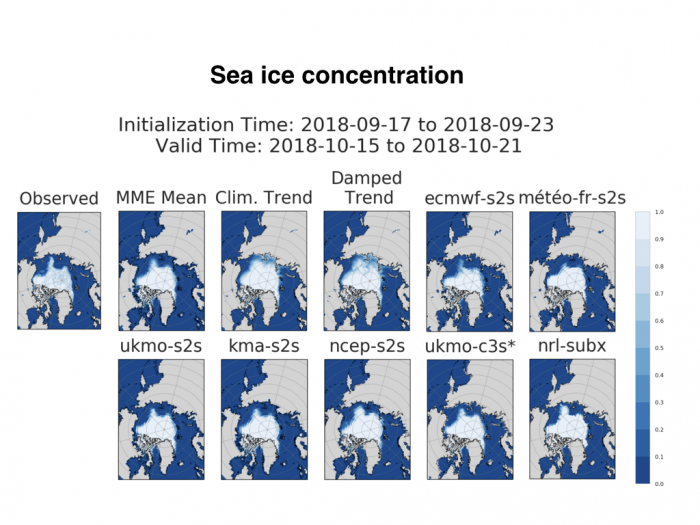
Note: For figure 5.3, forecasts and model information are available on the SIPN sea ice forecast data portal that contains modified Copernicus Climate Change Service information 2018. Neither the European Commission nor ECMWF is responsible for any use that may be made of the Copernicus information or data it contains.
Section 6. Antarctic Contributions
Since 2017, the Sea Ice Outlook has also accepted Antarctic contributions. We first review the 2018 conditions and then provide a basic assessment of the predictions that were collected.
Conditions in Context.
September coincides with the climatological sea ice extent maximum in the Southern Ocean. At that time of the year, sea ice covers on average 18.49 million square kilometers (1981–2010 mean value, NSIDC sea ice index data) and extends up to 55°S latitude (Figure 6.1). The northward extension of Antarctic sea ice is limited in large part by the position of the Antarctic Circumpolar Current, a strong eastward oceanic current that marks the separation between cold and warm surface waters in the Southern Ocean.
In 2018, September sea ice extent reached 17.88 million square kilometers (−0.61 million square kilometers or −3.3% with respect to climatology). This is the second lowest value on record after 1986 (17.68 million square kilometers; Figure 6.2). This anomaly is chiefly the result of sea ice retreat in the South Atlantic sector (Figure 6.1).
Since 2014, the all-time high record of Antarctic sea ice (19.76 million square kilometers; Massonnet et al., 2016), September sea ice extent has rapidly decreased each year, contrasting with the slow, yet significant, increase that had been noted between 1979 and 2014. Whether such a rapid drop in extent is part of the internal dynamics of the system or is an early warning sign of an external forcing is unclear as of now.
Predictions
Groups were solicited to forecast the September monthly mean total Antarctic sea ice extent. While (as with the Arctic) this diagnostic is useful to appreciate whether the large-scale conditions are correctly predicted or not, it is of limited use for more in-depth analyses. Groups had the opportunity to contribute three predictions (June, July, and August initializations), aligned with the timing of the Arctic contributions. As for Arctic predictions, the method of forecasting was left at the discretion of the contributing groups.
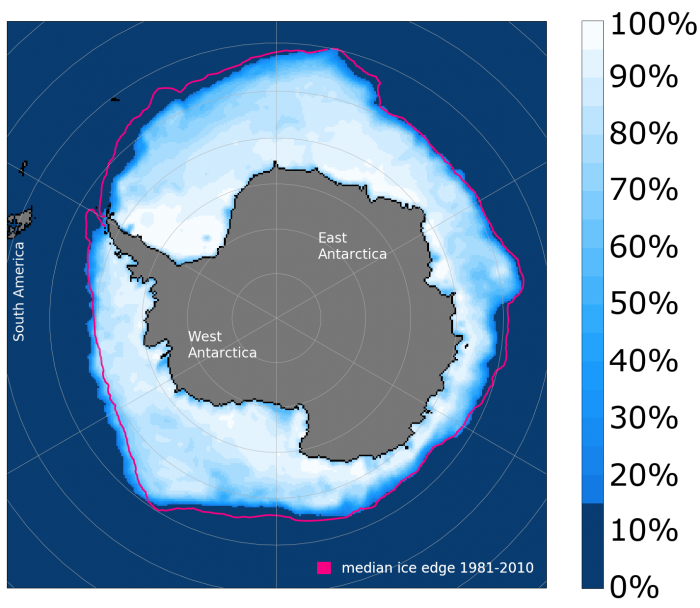
Forecasts were received from 10 groups. To benchmark these predictions, we also added three "trivial" forecasts: a climatological forecast (the 1979–2017 September sea ice extent average), an anomaly persistence forecast (the 2018 May, June, July sea ice extent anomaly with respect to 1979–2017 climatology, added to the September climatology), and a damped anomaly persistence forecast (same but the anomaly is weighted by the correlation of May, June, or July extents with September extents). Results follow in Figure 6.2.
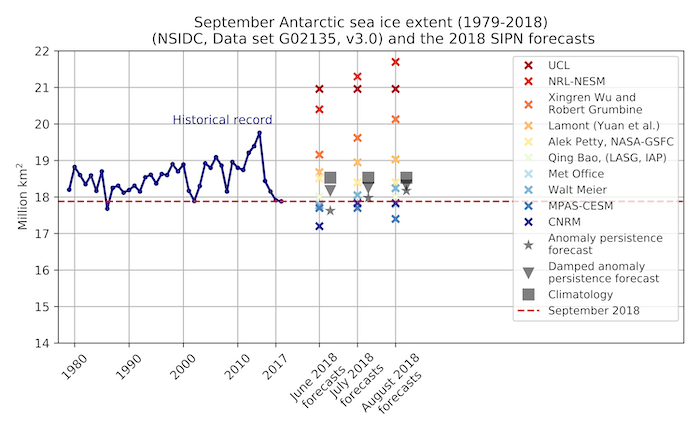
The first striking result is that, as for 2017, the full ensemble range exceeds (by a factor of 2) the historical range, regardless of initialization date. It is possible that the forecasting systems are not configured or trained for Antarctic sea ice prediction, which could explain the large spread. Alternatively, it could be that dynamical models, which constitute the bulk of the 10 predictions, overestimate the variance in winter sea ice extent (Zunz et al., 2013; Holland and Raphael, 2006). The second important result is that forecasts are too high compared to observations, and that this positive bias does not appear to reduce as one progresses over initialization dates. The origin of the positive bias is still unclear; a spatial analysis would be required which is not in the scope of this short report. The final remark is that the mean and median SIPN forecasts (18.95 and 18.32 million square kilometers for the August prediction, respectively) do not bring substantial added information compared to benchmark forecasts. In summary, it is fair to say that current predictions do not appear to be very informative, being at the same time collectively over dispersive and not different from simple forecasts. More hindcasts will be required to confirm this statement, but recall that the same results were obtained in 2017.
The sister project of SIPN2, the Sea Ice Prediction Network South (SIPN South), was initiated in 2017 to give a closer look at Antarctic sea ice predictions with focus on the summer season. A total of 13 groups contributed 160 forecasts last year, and it was found that the forecasting systems struggled to predict sea ice extent in the Ross Sea. The analysis is being repeated this year in conjunction with the Year Of Polar Prediction Special Observing Period that runs from 16 November 2018 to 15 February 2019. An initial look at the SIPN South forecasts for December-January-February can be downloaded as "An initial outlook at the austral summer 2018-2019 sea-ice forecasts in the Southern Ocean". Like winter predictions, summer predictions are far from being satisfactory for operational purposes and should be interpreted with caution. However, this gives scientists a chance to identify limitations in their prediction systems and eventually to try fixing them.
Section 7. Sea Ice Drift Forecast Experiment (SIDFEx) Results
This is the second year of the Sea Ice Drift Forecast Experiment (SIDFEx), a contribution to the Year of Polar Prediction (YOPP). SIDFEx is a community effort to collect and analyze Arctic sea ice drift forecasts at lead times from days to a year, based on arbitrary methods, for a number of sea-ice buoys and, ultimately, for the MOSAiC Drift, on a regular basis.
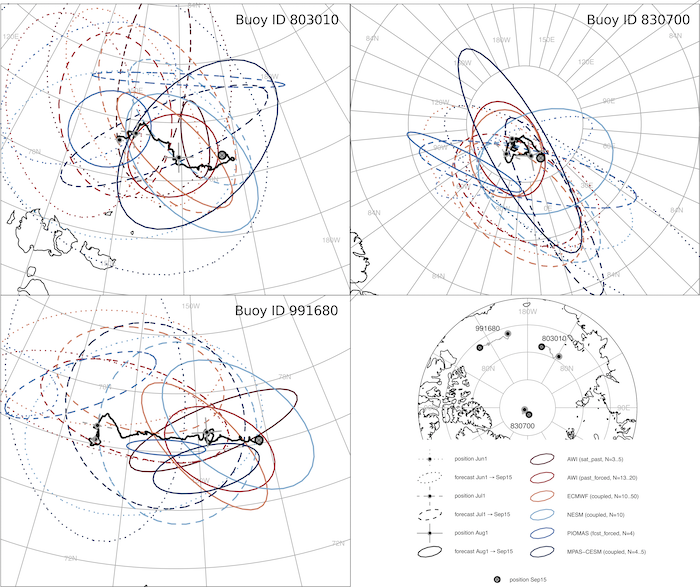
In Figure 7.1, above: Initial positions on the 1st of subsequent months from June through August 2018 are marked by grey-black dots on the observed drift trajectories (black curves). Ellipses enclose 90% probability of a bivariate normal distribution fitted to the respective positions comprising the ensemble forecasts, all valid for the target time 15 September 2018. Missing ellipses imply either that no forecast has been received, or that less than 3 ensemble members have remained until 15 September because trajectories were terminated, e.g., because the forecast sea-ice concentration fell below some threshold. The latter is method-dependent and affected in particular AWI (sat_past) which has an initial ensemble size of 10 (and for which no data are available for buoy 830700). N denotes the ensemble size (range) on 15 September. The overview map shows the observed drift from 1 June through 15 September for the three buoys.
Six of the eleven groups contributing to SIDFEx submitted seasonal ice drift forecasts for Arctic buoys aligned with the SIO 2018. Three of these are directly linked with SIO dynamical-model forecasts described above, namely AWI (past_forced = Kauker et al.), NESM, and MPAS-CESM. The European Centre for Medium Range Weather Forecasts (ECMWF) product is based on drift fields of the operational seasonal forecast system SEAS5. The Pan-Arctic Ice Ocean Modeling and Assimilation System (PIOMAS) product is based on drift fields of an ice-ocean model forced with NOAA-CFSv2 forecasts. The AWI (sat_past) product comprises ten-member ensembles that are based on satellite-derived drift fields of the previous 10 years and can thus be regarded as a climatological reference forecast.
The brief analysis of SIDFEx results presented in the 2017 post-season report considered only ensemble-mean forecast trajectories and associated errors, ignoring the explicit uncertainty information that the ensemble forecasts provide. However, due to the limited range of numerical weather prediction and hence wind patterns that drive ice motion, seasonal ice drift forecasts are highly uncertain and hence of limited value. This year we make a first attempt at a probabilistic assessment, although the analysis is kept mainly qualitative given that only three SIDFEx-targeted buoys that stayed in the ice cover and continuously provided data from 1 June through 15 September (considered here as the target date) can be evaluated.
To reduce complexity, we spatially “dressed” each forecast by fitting a bivariate normal distribution to the point cloud. While an isotropic (circular) distribution might be more appropriate for very small ensemble sizes, non-isotropic (elliptic) distributions are well suited to account for dominant ice drift directions which often occur, for example in parallel to coasts. We thus use ellipses and focus on those that enclose 90% of the integrated forecast probability density. If the forecasts were reliable, these ellipses would contain the verifying observed position in approximately 90% of all cases. Not surprisingly, it is found that the spatial uncertainty in the position forecasts for 15 September tends to decrease as the initial time approaches the target time for all buoys (Figure 7.1).
Combining all initial dates, a hit ratio of close to 90% is achieved for buoy 830700, which was located close to the North Pole and overall did not move far from its initial position on June 1st: Twelve out of the 14 ellipses contain the verifying observed position on 15 September (Figure 7.1). In contrast, the hit ratio is considerably lower for buoy 803010 (5 out of 16) and even lower for buoy 991680 (1 out of 15). This hints at biases and/or insufficient dispersion of the forecast methods. However, the small sample size and the strong statistical dependence between the forecasts hampers robust conclusions. After all, the different models/methods attempted to forecast the same three trajectories (from three initial times), and even these three are not independent. For example, the persistent eastward drift of the two buoys in the Pacific sector, only about 1,200 km apart, was caused essentially by the same large-scale pattern of atmospheric circulation anomalies with low surface pressure over northern Greenland and Alaska and high surface pressure over Siberia (Figure 3c.1, right panel).
The very small effective sample size also prevents a meaningful ranking of the different models/methods, or to draw conclusions related to methodological differences. A proper ranking of probabilistic forecasts would also need to consider more aspects besides reliability, in particular a measure of sharpness. We expect that with an increasing sample size it will be possible to identify models/methods that tend to generate unreliable forecast distributions. For these it will be particularly interesting to track down model errors causing unrealistic ice drift, and/or consider forecast calibration methods which are common practice for subseasonal-to-seasonal forecasting in general.
Section 8. Sea Ice Forecasts for Alaska Marine Shipping Industry
A recent assessment of Arctic maritime traffic by the Ocean Conservancy estimates that 2,300 vessels operated in the polar code region in 2014. Fishing related maritime activity was the most prevalent. Of the 2,300 vessels identified, approximately 721 (31%) were fishing vessels with gross tonnage of 10,000 and less. If measured by days of operation, fishing vessels accounted for 89,592 operational days which comprised 46% of the total operational days (193,756) in 2014. Enhanced seasonal sea ice forecasting has practical applications to the management of Arctic maritime activity. Given the prevalence of fishing related activity, our initial efforts have focused on identifying how seasonal sea ice forecasts can be used by vessels operating in the Bering Sea crab fishery.
The Bering Sea crab fishery is economically important with harvest values first off the boat of $249 million in 2016 (McDowell, 2017). Snow crab are of particular interest. Since 2005, the snow crab fishery has been managed as a limited entry program through the use of an individual fishing quota (IFQ). During a typical season approximately 70 vessels operate in the region. Vessels pursuing snow crab must frequently operate near the sea ice edge owing to the movement of crab stocks.
As a consequence, there is a defined need for information about the location of the sea ice edge as well as the speed and direction of sea-ice movement. Given that crab harvest quantities are quota constrained, the objective is to identify how the industry can use enhanced sea ice forecasts to reduce operations costs and ensure the continued safe operation of their vessels. Short-term forecasts on the movement of ice and position of the ice edge (up to a week) are outside of the purview of SIPN2 with its focus on (sub)seasonal forecasts. However, enhanced forecasts on timescales of weeks to possibly months may be relevant from the perspective of equipment staging, timing of operations, and identifying target areas. SIPN2 Project Team members, in collaboration with the industry, will examine whether the forecasts can help reduce the costs associated with the movement harvest equipment.
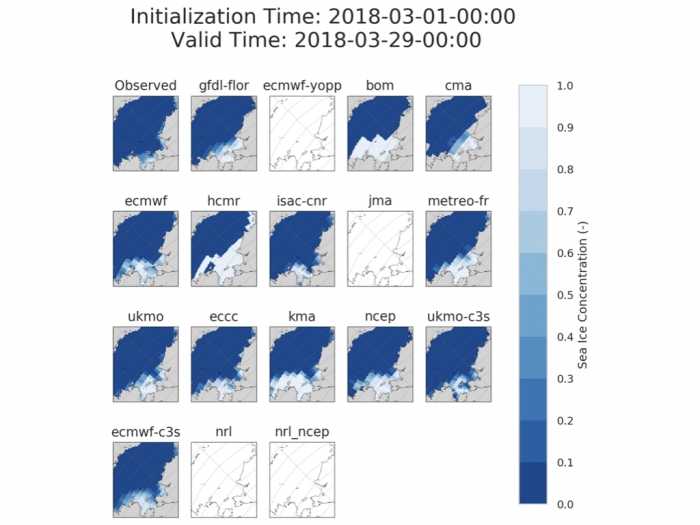
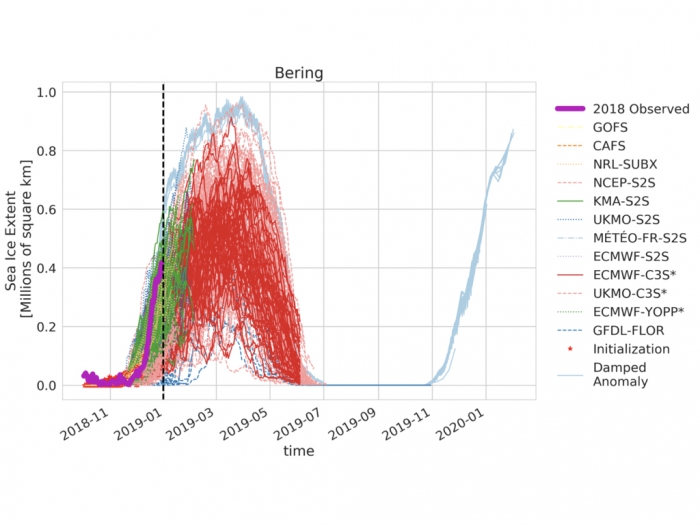
The type of information product that may be of potential value is illustrated in Figure 8.1, showing output from the suite of models that are part of SIPN2 efforts and aggregated at the SIPN sea ice forecast data portal. Such long-range forecasts of ice distribution and ice edge location could be combined with broader, index-type predictions that consider the total ice extent in the region (Figure 8.2). As illustrated for the 2018/19 fall and winter seasons, model predictions may provide longer-range (1-3 months) guidance on whether to expect well above or below normal ice extent in the Bering Sea. This requires further study, including an assessment of the predictive skill of late fall forecasts and persistence of fall ice extent anomalies into the crabbing season.
Section 9. Thoughts from the 2018 SIO
The SIO 2018 Post-Season Report attempted to bring together more sources of information and analysis than we have in the past to enhance our understanding of the predictability of sea ice. What started out as a record low winter did not result in a record September minimum. Ideas are provided below on how to improve our understanding of sea ice predictability and how to create information products that are accessible to stakeholders so that the science can be used in decision making to improve outcomes. Here are several take-away thoughts from the SIPN2 team after the 2018 SIO season.
- The availability of online analysis tools to quickly plot and analyze data helps to move the science forward. Some tools such as the Earth System Research Laboratory (ESRL) plotting system have been available for nearly two decades but the recent increase in such platforms will help speed scientific discovery. The SIPN2 portal has contributed to expanding the types of analysis that is possible for the SIO.
- The diverse foci and interests of the contributors to the SIO enriches our thinking about sea ice predictability to help sharpen the scientific understanding as well as how it can be applied.
- Making seasonal forecasts accessible to the users is still a big challenge. The communication of the forecasts and their uncertainties will require novel thinking to make progress. Also, while there are many users ready for skillful seasonal forecasts, there are others who have yet to envision how to use such information.
Further ideas from the community are welcomed.
References
Section 3b. Ocean Heat
Steele, M., and S. Dickinson. 2016. The phenology of Arctic Ocean surface warming, J. Geophys. Res. Oceans, 121, 6847–6861, doi:10.1002/2016JC012089.
Steele, M., S. Dickinson, J. Zhang, and R. Lindsay. 2015. Seasonal ice loss in the Beaufort Sea: Toward synchrony and prediction, J. Geophys. Res. Oceans, 120, 1118–1132, doi:10.1002/2014JC010247.
Section 6. Antarctic Contributions
Holland, M. M., & Raphael, M. N. 2005. Twentieth century simulation of the southern hemisphere climate in coupled models. Part II: sea ice conditions and variability. Climate Dynamics, 26(2–3), 229–245. doi:10.1007/s00382-005-0087-3
Massonnet, F., V. Guemas, N. Fuckar and F. J. Doblas-Reyes. 2015. The 2014 high record of Antarctic sea ice extent. In Explaining Extreme Events of 2014 from Climate Perspective, Bulletin of American Meteorological Society 96, S163-S167, doi:10.1175/BAMS-D-15-00093.1
Zunz, V., H. Goosse and F. Massonnet. 2013. How does internal variability influence the ability of CMIP5 models to reproduce the recent trend in Southern Ocean sea ice extent? The Cryosphere, 7 451-468
Report Credits
This 2018 Sea Ice Outlook Full Post-Season Report was developed by the SIPN2 Leadership Team with contributions from community partners.
Report Lead:
Uma Bhatt, University of Alaska Fairbanks, Geophysical Institute
Additional Contributors:
Peter Bieniek, University of Alaska Fairbanks, International Arctic Research Center
Edward Blanchard-Wrigglesworth, University of Washington, Department of Atmospheric Sciences
Hajo Eicken, University of Alaska Fairbanks, International Arctic Research Center
Helge Goessling, Alfred-Wegener Institute, Helmholtz Centre for Polar and Marine Research
Larry Hamilton, University of New Hampshire, Carsey School of Public Policy
Joseph Little, University of Alaska Fairbanks, School of Management
[François Massonnet(https://www.elic.ucl.ac.be/modx/index.php?id=73), Université Catholique de Louvain (Belgium)
Walt Meier, National Snow and Ice Data Center
James Overland, NOAA, Pacific Marine Environmental Laboratory
Mark Serreze, University of Colorado Boulder, NSIDC
Michael Steele, University of Washington, Applied Physics Laboratory
Julienne Stroeve, University College London, National Snow and Ice Data Center
Rick Thoman, University of Alaska Fairbanks
Bruce Wallin, University of Colorado, Boulder, NSIDC
John Walsh, International Arctic Research Center, University of Alaska Fairbanks
Muyin Wang, NOAA and the Joint Institute for the Study of the Atmosphere at the University of Washington
Nicholas Wayand, University of Washington, Department of Atmospheric Sciences
Helen Wiggins, Arctic Research Consortium of the U.S.
Xiaojun Yuan, Columbia University, Lamont-Doherty Earth Observatory
Editors:
Betsy Turner-Bogren, ARCUS
Stacey Stoudt, ARCUS
Lisa Sheffield Guy, ARCUS
Helen Wiggins, ARCUS
Suggested Citation:
Bhatt, U. S., P. Bieniek, E. Blanchard-Wrigglesworth, H. Eicken, H. Goessling, L. C. Hamilton, J. Little, F. Massonnet, W. Meier, J. E. Overland, M. Serreze, M. Steele, J. Stroeve, R. Thoman, B. Wallin, J. Walsh, M. Wang, N. Wayand, H. V. Wiggins, and X. Yuan. Editors: Turner-Bogren, B., L. Sheffield Guy, S. Stoudt, and H. V. Wiggins. March 2019. "2018 Sea Ice Outlook Full Post-Season Report." (Published online at: https://www.arcus.org/sipn/sea-ice-outlook/2018/post-season.)
This Sea Ice Outlook Report is a product of the Sea Ice Prediction Network–Phase 2 (SIPN2), which is supported in part by the National Science Foundation under Grant No. OPP-1748308. Any opinions, findings, and conclusions or recommendations expressed in this material are those of the author(s) and do not necessarily reflect the views of the National Science Foundation.


