Outlook Report
Executive Summary
Thank you to the groups that contributed to the 2017 June report. We received 33 contributions that include pan-Arctic predictions, 2 additional contributions with a regional focus, and 7 Antarctic forecasts.
This June Outlook report was developed by lead authors Julienne Stroeve (NSIDC) and Walt Meier (NASA GSFC), with contributions from Ed Blanchard-Wrigglesworth (UW), François Massonnet (Université Catholique de Louvain) and the rest of the SIPN Leadership Team.
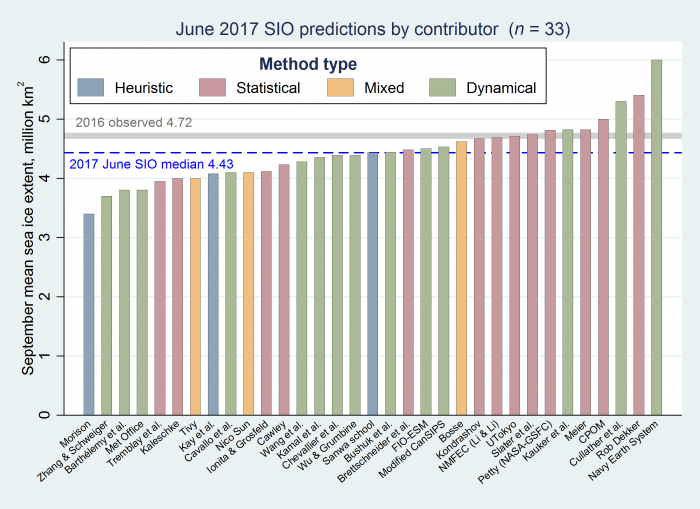
The median Outlook value for September 2017 sea ice extent is 4.43 million square kilometers with quartiles of 4.10 and 4.71 million square kilometers (See Figure 1 in the Overview section, below). Contributions are based on a range of methods: statistical, dynamical models, heuristic, and two informal polls. Compared to last June, the spread in the Outlook contributions is larger: the overall range is 3.40 to 6.0 million square kilometers, compared to last year's spread of 3.40 to 5.23 million square kilometers. The median Outlook value is also up from last year by 135,000 square kilometers. To place this year's Outlook in context, consider recent observed values of 4.28 million square kilometers in 2007, 3.60 million square kilometers in 2012, and 4.72 million square kilometers in 2016. Only one participant suggests a new record low is likely, though several others suggest it is possible.
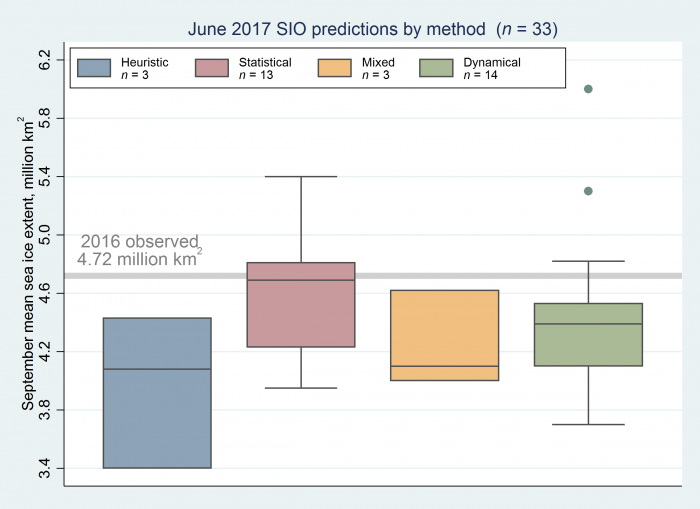
Analysis of the 14 dynamical model contributions shows that the range among the individual outlooks is less than last year and as a whole. For the 14 dynamical models, the median prediction is 4.39 million square kilometers, with quartiles of 4.10 and 4.53 million square kilometers. This is compared to the 13 statistical contributions that show a larger median extent of 4.69 million square kilometers and range from 3.95 to 5.4 million square kilometers (quartiles of 4.23 and 4.81 million square kilometers). The highest prediction of 6.0 million square kilometers is based on a dynamical model forecast using the US Navy Earth System Model (NESM), whereas the lowest prediction of 3.4 million square kilometers comes from a heuristic contribution.
A section on predicted spatial fields includes a discussion on sea ice probability (SIP) and the first ice-free day (IFD) from a number of dynamical models. Finally, a section on current conditions includes discussion on this winter's record low sea ice conditions, atmospheric conditions, and regional ice conditions.
Contributions to the new SIPN/Year of Polar Prediction community forecast experiment, the Sea Ice Drift Forecast Experiment (SIDFEx), are coming in. Results will be discussed in a future Sea Ice Outlook report.
(Please note: The Sea Ice Outlook provides an open process for those interested in Arctic sea ice to share predictions and ideas; the Outlook is not an operational forecast.)
June call for contributions
Overview
The Outlook contributions this June are based on a range of methods: statistical, dynamical models, estimates based on trends, and subjective information, with 4 of the forecasts submitted by citizen scientists (Figure 1). Since 2008 when the SIO started, we have seen a shift from less quantitative heuristic methods towards more quantitative contributions based on statistical and dynamical models. This June, we had 3 heuristic contributions (two from informal polls), 3 mixed contributions that rely on a combination of statistical approaches and heuristic assessment, 13 contributions using statistical methods, and 14 using dynamical models—12 of which were fully-coupled climate models. Fully-coupled models simulate all of the major components of the climate system—including ice, ocean, atmosphere, and land—and allow these to vary and interact together within the model, which provides a more complete representation of the complex sea ice system.
The distribution of Outlooks for statistical and dynamical models have a median extent that differs by more than it did last June, 0.28 million square kilometers compared to 0.15 million square kilometers in 2016 (Figure 2). There is also a larger spread for the statistical models than the dynamical models of 0.61 million square kilometers, which was also true in 2016 and 2015. The smallest spread is from the heuristic contributions, which give a median forecast for the September sea ice extent of 4.08, ranging from 3.4 to 4.43 million square kilometers.
The overall width of the distribution of Outlooks has increased compared to last year: the interquartile spread across all types of contributions is 0.64 million square kilometers compared to 0.53 million square kilometers in 2016. The overall range has also increased from 3.4 to 6.0 million square kilometers, compared to 3.4 to 5.23 million square kilometers in June 2016. Note that the extreme low forecast comes from a heuristic contribution that considered the amount of multiyear ice over the winter of 2016/2017 together with the mean winter atmospheric circulation pattern (Morison) whereas the extreme high forecast comes from the pre-operational US Navy Earth System Model (NESM).
2017 Modeling Contributions at a Glance
This year we received 14 June SIO submissions from dynamical models, of which 3 were from ice-ocean models forced by atmospheric reanalysis or other atmospheric model output and 12 were from fully-coupled general circulation models. The median extent predicted by the models this year is 4.41 million square kilometers, which is slightly lower than last June's forecast of 4. 58 million square kilometers.
Comment On Predicted Spatial Fields
This year we received a record number of September Sea Ice Probability (SIP) forecasts (Figure 3). SIP is defined as the fraction of ensemble members in an ensemble forecast with September ice concentration in excess of 15%.
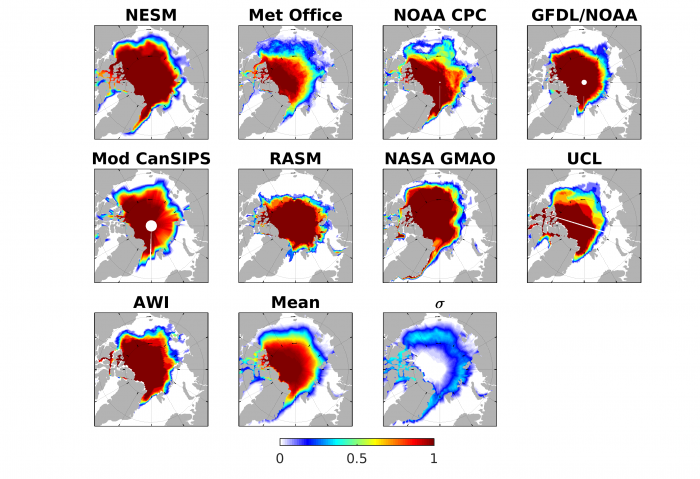
Most forecasts show open conditions for most of the Siberian and Alaskan coastlines, and predict a low chance that the Northeast Passage remains ice covered this summer (mean SIP of ~20%). Ice conditions in the Beaufort and Chukchi seas appear to be highly uncertain, with significant spread across different forecasts, whereas there is better agreement in the Laptev Sea. It is also interesting that some models' SIP forecast are diffuse across the ice edge (e.g., the Met Office and NOAA CPC forecasts), indicative of large intra-model ensemble spread, yet others are more abrupt (e.g., RASM), indicative a highly confident forecast.
The forecasts for Ice Free Day (IFD) are shown in Figure 4. IFD is the date in the melt season at which the ice concentration at a given location first drops below 15%.
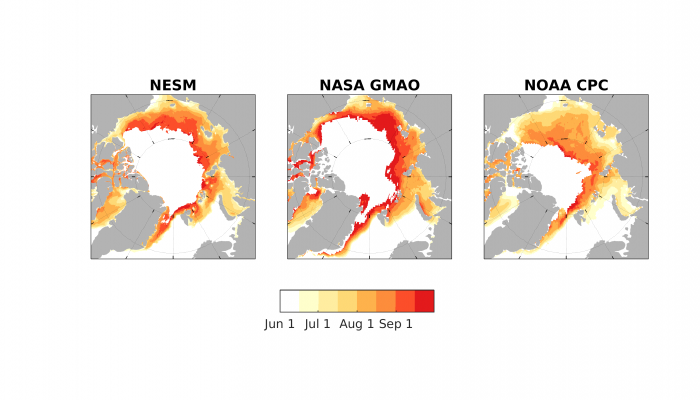
Forecasts of IFD tend to disagree on the timing of opening in the Laptev, Beaufort and Barents seas, while there is reasonable agreement in forecasting an early Chukchi opening and the patterns of IFD forecast in the Atlantic Arctic (Svalbard vicinity). Considering the observed SIC patterns for late June (discussed below in Current Conditions), the early Chukchi, Laptev, and west Beaufort openings shown by NOAA CPC appear to be skillful forecasts.
We received the initial conditions fields used in seven dynamical models this June. We encourage other participants to contribute these fields in July and August. They will be described in the post-season report.
Current Conditions
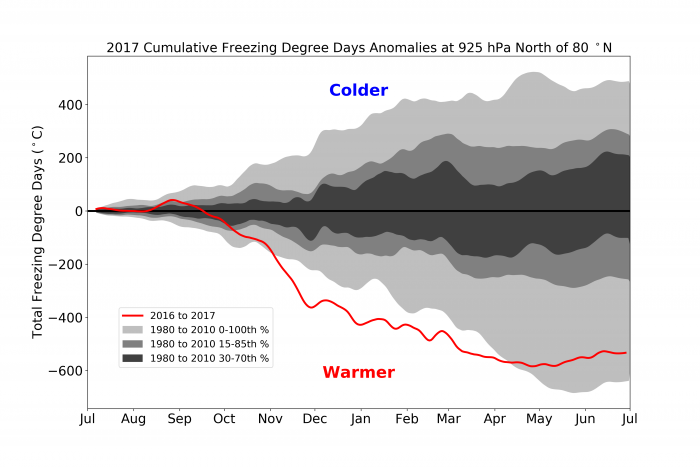
The winter preceding this summer's melt season was the most extreme in terms of sea ice extent in the satellite record (starting in 1979). After the 2016 September minimum, the Arctic ice growth was very sluggish, leading to well-below average extent through the 2016/2017 ice-growth season. Daily Arctic sea ice extent was at record low levels nearly continuously from October 2016 until May 2017. Record low monthly extents were set in October 2016 through April 2017, except for December 2016, when the monthly average field was slightly higher than 2010. Furthermore, the maximum extent reached on March 7, 2017 was the lowest maximum recorded yet in the satellite data record. These record low winter ice extent conditions were largely a result of a much warmer winter than average, which led to a reduction in the number of freezing degree days (Figure 5). Ice formation in the Barents Sea for example was delayed by more than 2 months.
However, since May, air temperatures have been generally cooler than average over the eastern Arctic, leading to slow ice retreat in that region. On the other hand, in the western Arctic open water formed very early within the Chukchi Sea and off the coast of Alaska, with the least amount of sea ice recorded during the month of May for the Chukchi Sea. This was likely in part a result in delayed ice formation, with the Chukchi Sea not freezing up until December, a month later than the 1981-2010 long term average, combined with a period of strong winds from the north that helped to push ice southward into the Bering Sea. As discussed by the regional analysis from Druckenmiller and Eicken, the unusual open water in the Chukchi Sea has raised expectations for a rapid onset of bottom ice ablation near Utqiagvik, Alaska (formerly Barrow). First-year ice thickness was well below normal at 1.25 to 1.30m as observed by Chris Polashenski (CRREL) on June 12.
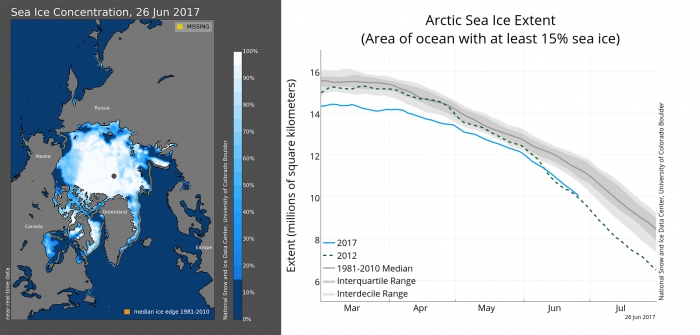
Ice retreat was generally sluggish during the month of May for the Arctic as a whole, but the pace of ice retreat picked up in June, with the pan-Arctic sea ice extent trailing 2012 by 140,000 square kilometers on June 26 (Figure 6); the lowest extent on June 26 occurred in 2010.
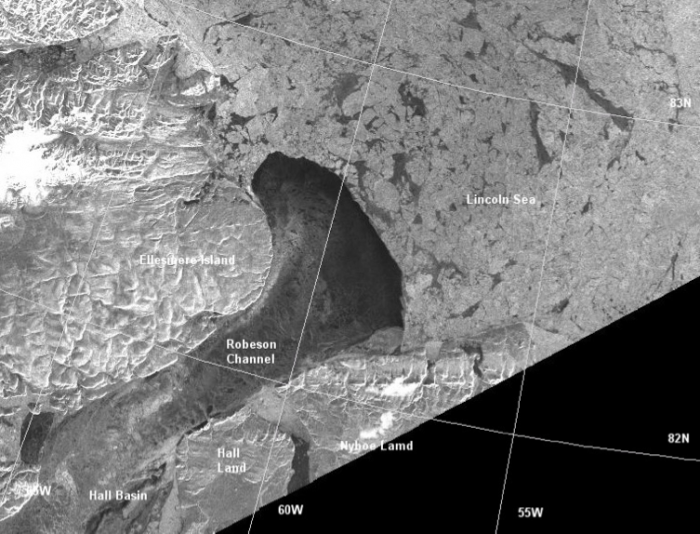
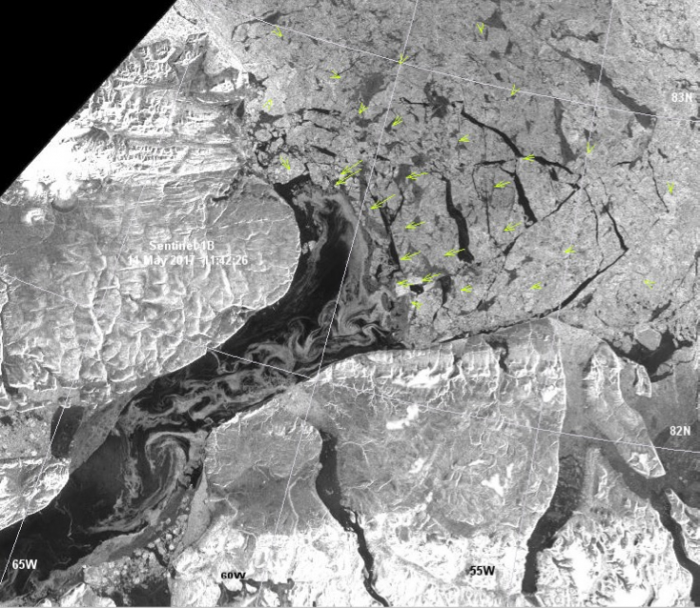
Preben Gudmandsen from the National Space Institute at the Technical University of Denmark provided updates to sea ice conditions in Nares Strait and the Lincoln Sea. In this region, ice conditions are largely controlled by the formation of an arch in the Lincoln Sea that extends between the coasts of Ellesmere Island and Northwest Greenland (Nyboe Land). This arch is mainly formed by small multiyear ice floes linked by new ice formation within leads. This year it formed at the end of January 2017, essentially blocking any ice drift from the Lincoln Sea into the Robeson Channel (Figure 7) and eventually into Baffin Bay. During the subsequent months, new ice formed below the arch and further down the Strait, drifting mainly along the coast of Ellesmere Island. This arch began disintegrating on 10 May (Figure 8) and by 1 June the ice from the Lincoln Sea had drifted more than 250 km south, reaching the Kane Basin, with daily movements of up to 63 km in the northern part of the Kennedy Channel.
Antarctic Contribution
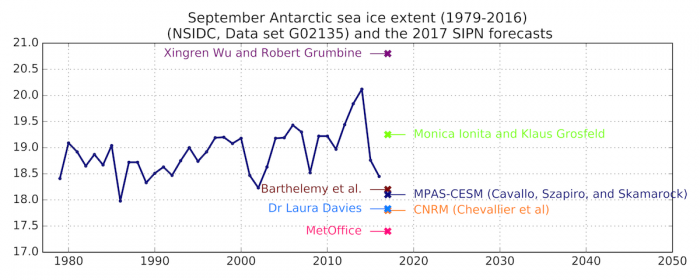
For this tenth anniversary and for the first time in its young history, the SIO has welcomed Antarctic contributions. This year, seven outlooks were submitted. Caution should be used in the interpretation of the results. The circumpolar sea ice extent is a diagnostic that allows large compensations of errors, and no spatial information is available from the forecasts. In addition, the prediction systems are usually calibrated for the Arctic rather than for the Antarctic. It is also worth noting that predicting the winter Antarctic sea ice coverage is interesting from an academic perspective, but is generally not relevant for stakeholders. In that sense, this exercise should be seen as a first attempt to engage the SIO contributors in a new forecasting challenge.
The seven forecasts cover the range 17.4 - 20.8 million km² (Figure 9). The distribution therefore encompasses the observed distribution of all September sea ice extents since 1979. This is a remarkable range compared to the Arctic submissions, for which the observed climatological average lies well above the maximum forecast (Figure 1). From the (small) ensemble available, it can be surmised that the prediction systems taken together will probably not outperform a climatological forecast. We are awaiting the next submissions (July and August) to confirm this statement. Specific prediction exercises for the Antarctic summer season (February 2018 and February 2019) will be conducted in the framework of the project SIPN South (www.climate.be/users/fmasson/SIPN-South_20170531.pdf).
Key Statements/Executive Summaries From Individual Outlooks
The pan-Arctic Outlooks are listed below in order of lowest to highest predicted September extent. Extent and uncertainty (in parentheses) values are provided below in units of millions of square kilometers unless noted otherwise. All individual outlooks can be downloaded as PDFs at the bottom of this webpage. Note that regional, Antarctic, and any informal contributions do not have key statements, but are available as PDFs below.
Morrison, 3.4 +/- 1.0, Heuristic. Method is heuristic based on experience, analysis of multiyear ice over the winter 2016-17 by Ron Kwok, NSIDC ice extent record, and NOAA AO record.
Zhang and Schweiger, 3.7 +/- 0.5, Dynamical Model. Forecasts are obtained from a numerical seasonal forecasting system. The forecasting system is based on a synthesis of PIOMAS, the NCEP CFS hindcast and forecast atmospheric forcing, and satellite observations of ice concentration. The CFS forecast ranges from hours to months: there are a total of 16 CFS ensemble forecast runs every day, of which four ensemble runs go out to 9 months, three runs go out to 1 season, and nine runs go out to 45 days (Saha et al., 2014). These ensemble runs all create 6-hourly forecast atmospheric data that are widely accessible in real time, thus ideal for forcing PIOMAS forecasts on daily to seasonal time scales. Here we used four CFS forecast ensemble members to drive the PIOMAS ice–ocean ensemble forecasts. Ensemble mean values from these four members are considered to be the prediction. To obtain the "best possible" initial ice-ocean conditions for the forecasts, we conducted a retrospective simulation that assimilates satellite ice concentration and sea surface temperature data through the end of May 2017 using the CFS hindcast forcing data. After that, four ensemble PIOMAS forecast runs were conducted using atmospheric forecast forcing from four CFS ensemble runs. Additional information about PIOMAS prediction can be found in Zhang et al. (2008).
Barthélemy et al., 3.8, Dynamical Model. Estimate is based on results from ensemble runs with the global ocean-sea ice coupled model NEMO-LIM3. The ensemble members are expected to sample the atmospheric variability that may prevail this summer. In practice, the model is forced with NCEP/NCAR atmospheric reanalysis data from 1948 to May 31, 2017. No data are assimilated during this simulation. Ten ensemble members are then started from the obtained model state, each using atmospheric forcing from one year between 2007 and 2016. This choice is a compromise between a sufficiently large ensemble and the rapidly changing Arctic atmospheric conditions in recent decades. The estimate given above corresponds to the ensemble median monthly September extent, corrected by the mean bias between simulated and observed values reported in the NSIDC sea ice index, which equals 0.6 million square kilometers. The model configuration is exactly the same as in our last four years contributions. Additional details can be found in our 2013 reports.
Met Office, 3.8 +/- 0.6, Dynamical Model. Ensemble coupled model seasonal forecast from the GloSea5 seasonal pre-diction system [MacLachlan et al., 2015], using the Global Coupled 2 (GC2) version [Williams et al., 2015] of the HadGEM3 coupled model [Hewitt et al., 2011]. Forecast compiled together from forecasts initialized between 21 Apr and 11 May (2 per day) from an ocean and sea ice analysis (FOAM/NEMOVAR) [Blockley et al., 2014, Peterson et al., 2015] and an atmospheric analysis (MO-NWP/4DVar) [Rawlins et al., 2007] using observations from the previous day. Special Sensor Microwave Imager Sensor (SSMIS) ice concentration observations from EUMETSAF OSI-SAF [OSI-SAF] were assimilated in the ocean and sea ice analysis, along with satellite and in-situ SST, sub-surface temperature and salinity profiles, and sea level anomalies from altimeter data. No assimilation of ice thickness was performed.
McGill (Tremblay et al.), 3.95 +/- 0.47, Statistical. Prediction for the monthly mean Arctic sea ice extent (SIE) of September 2017 is 3.95 million square kilometers. We produce the prediction as a sum of the linear trend (climatology) and departure from the trend (interannual variability). We take the long-term linear trend for the 1993-2016 period. We use the mean winter (DJFMA) Arctic Oscillation (AO) index in a linear least squares fit model as a predictor for the anomaly of monthly mean September SIE over the same period. This builds on the idea of winter dynamic preconditioning - see Williams et al. (2016). Since we use the mean DJFMA AO index, our prediction is made on May 1 and does not change during the summer. We use the Sea Ice Index V2 monthly SIE dataset (NSIDC) and the monthly AO index distributed by NOAA.
Kaleschke, 4.0 +/- 0.5, Statistical. A regression is calculated using the mean thickness_May * concentration_Sept > h with a threshold of h=1.5 m and the long-term mean September sea ice concentration.
Tivy (Canadian Ice Service), 4.0, Mixed. As with previous CIS contributions, the 2017 forecast was derived by considering a combination of methods: 1) a qualitative heuristic method based on observed end-of-winter Arctic ice thickness/extent, as well as winter surface air temperature, spring ice conditions and the summer temperature forecast; 2) two simple statistical methods based on an Optimal Filtering Based Model (OFBM), that uses an optimal linear data filter to extrapolate the September sea ice extent time-series into the future and 3) a Multiple Linear Regression (MLR) prediction system that tests ocean, atmosphere and sea ice predictors. Based on winter air temperatures and sea ice extents and thickness, a September 2015 minimum ice extent value of 3.8106 square kilometers is heuristically predicted. The CIS OFB models predict 4.24106 square kilometers and 3.78106 square kilometers and the CIS MLR model predicts 4.2 *106 square kilometers. The average forecast value of the four methods combined is 4.0106 square kilometers.
Kay, Bailey, and Holland (NCAR/CU), 4.08 +/- 0.48, Heuristic. An informal pool of 30 climate scientists in early June 2017 estimates that the September 2017 ice extent will be 4.08 million sq. km. (std. dev. 0.48, min. 3.10, max. 5.09). Guesses were collected by sending an e-mail out to the scientists.
Cavallo et al., (MPAS-CESM) 4.1, Dynamical Model. For our experimental forecast, we use CAM-MPAS on an Arctic-refined (92-25 km) atmospheric mesh coupled to 1 degree land, ocean, and sea ice in CESM. The atmosphere is cold-started with GFS analysis and the other components are initialized from spun-up restarts of the CESM Large Ensemble. Extrapolating the climatological trend for September SIE, we would expect ~4.5 million square kilometers for September 2017 Arctic SIE. This corresponds to 2021 in the ensemble mean. Forecasts are integrated as if in 2021 under an RCP8.5 scenario. The September mean SIC is used directly with a 15% threshold for extent.
Nico Sun, 4.1, Mixed. The feedback system between sea ice area, extent, volume and energy absorption is a dynamic model. The prediction of extent to area ratios for the remaining melting season is statistical.
Ionita and Grosfeld, 4.12, Statistical. The forecast scheme for the September sea ice extent is based on a methodology similar to one used for the seasonal prediction of river streamflow. The basic idea of this procedure is to identify regions with stable teleconnections between the predictors and the predictand. The September sea ice extent has been correlated with the potential predictors (e.g. ocean heat content, sea surface temperature, sea level pressure, precipitable water content, surface zonal and meridional wind) from previous months, up to 8 months lag, in a moving window of 21 years.
Cawley, 4.2 +/- 1.14 Statistical. Non-linear Gaussian process regression model with squared exponential covariance function, hyper-parameters optimized by marginal likelihood maximization.
Wang, Callow, and Zhang (Wang et al.), 4.28 +/- 0.22, Dynamical model. The outlook is from CPC experimental dynamical ensemble forecast. The ensemble includes 20 forecast members.
Kamal et al. (RASM), 4.35 +/- 0.21, Dynamical Model. Twelve seasonal forecast ensemble members were used to determine a pan-Arctic and Alaskan regional ensemble mean September 2017 ice extent. Those were based on three different RASM initial states (or root cases, produced by three different 09/79-05/17 simulations. Each root case was run forward with four different versions of CFSv2 boundary forcing data starting from 06-01-2017 each root case is split to create four ensemble members forced with CFSv2 data initialized on May 30 at hour: 0000, 0600, 1200 and 1800.
Chevallier et al. (CNRM), 4.39 +/- 0.60, Dynamical Model. The CNRM outlook is a model estimate based on a dynamical ensemble forecast. Initial conditions from the week before 1 June 2017 are used. We generate a total 51 members by adding statistical perturbations during the run.
Wu and Grumbine, 4.39 +/- 0.35, Dynamical Model. We ran the NCEP CFSv2 model with 31-case of May 2017 revised ICs. The IC was modified from real time CFSv2 of each day at 00Z by thinning the ice pack (based on test from previous years' sea ice outlook). If this thinning would have eliminated ice from areas observed to have sea ice, a minimum thickness of 10 cm was left in place for the ice IC.
Sanwa Elementary School 4.43, Heuristic. Monthly mean ice extent in September will be about 4.43 million square kilometers. We estimated the minimum ice area through discussion among 21 students based on the ice map from 2004 to 2016.
Bushuk et al. (GFDL/NOAA), 4.44 +/- 0.33, Dyanmical Model. Our forecast is based on the GFDL Forecast-oriented Low Ocean Resolution (FLOR) model (Vecchi et al., 2014), which is a coupled atmosphere-land-ocean-sea ice model. The model is initialized from an Ensemble Kalman Filter coupled data assimilation system (ECDA; Zhang et al., 2007), which assimilates observational surface and subsurface ocean data and atmospheric reanalysis data. The system does not assimilate any sea ice concentration or thickness data. The FLOR atmospheric initial conditions are produced from an AMIP run forced by observed SST and sea ice. Historical radiative forcing is used prior to 2005 and the RCP4.5 scenario is used for predictions after 2005. For the predictions initialized after 2004, the aerosols are fixed at the RCP4.5 scenario year of 2004. The performance of this model in seasonal prediction of Arctic sea ice extent has been documented in Msadek et al. (2014) and Bushuk et al. (2017). For an evaluation of the model's September sea ice extent prediction skill from a June 1 initialization, see Section 2 below.
Brettschneider, Walsh, and Thoman (Brett Schneider et al.), 4.48, (3.88 to 5.25), Statistical.The predicted quantity is the departure from the linear trend of historical (1979-2016) pan-Arctic sea ice extent. For 2017, the weighted mean September ice extent of the best historical analog years (defined by closeness of fit to atmospheric fields through May 2017) was 4.48 million square kilometers, slightly below the trend line. This value is lower than the past four September values, but greater than the 2012 minimum.
FIO-ESM (Qiao et al.), 4.5 +/- 0.5, Dynamical Model. This is a model contribution. The initialization is also from the same model (FIO-ESM) but with data assimilation. The data assimilation method is Ensemble Adjustment Kalman Filter (EAKF). The data of SST (sea surface temperature) and SLA (sea level anomaly) from 1 January 1992 to 1 Jun 2017 are assimilated into FIO-ESM model to get the initial condition for the prediction of the Arctic Sea Ice. There is no sea ice data assimilation.
Modified CanSIPS (Merryfield et al.), 4.53 +/- 0.72, Dynamical Model. CanSIPS combines forecasts from two models, CanCM3 and CanCM4, with a total of 20 ensemble members (10 from CanCM3, 10 from CanCM4). The Arctic SIE anomaly was calculated for each individual ensemble member relative to the 1981-2010 climatology for the respective model. These anomalies were then added to the NSIDC climatological value of 6.5 million square kilometers, and then averaged over all 20 ensemble members to yield a total SIE of 4.53 million square kilometers.
Bosse, 4.62, Mixed. Estimate is derived from the 0 to 700m OHC of the Atlantic part of the arctic. For the detailed mapping of the data from Argo and the physical explanation see https://www.arcus.org/files/sio/23220/bosse_july2015.pdf. The average of the monthly June to September OHC-data of the year n is the input for a linear regression to estimate the September mean of the sea ice extent for the year n+1. Cryosat-2 data is also considered.
Kondrashov, 4.67, Statistical. The forecasting methodology relies on Data-adaptive Harmonic Decomposition (DAH) and Multilayer Stuart-Landau Models (MSLM) techniques [Chekroun and Kondrashov, 2017]. This methodology is applied to the Multisensor Analyzed Sea Ice Extent – Northern Hemisphere (MASIE-NH) 4km dataset subdivided into several Arctic regions. The daily MASIE-NH data was averaged to provide weekly-sampled dataset. DAH-MSLM predictive model has been derived from MASIE-NH anomalies with annual cycle removed. The key features of DAH-MSM model are memory effects conveyed by the non-Markovian model formulation and data-adaptive basis that helps to disentangle complex regional dynamics of MASIE by harmonic spatio-temporal patterns. The stochastic DAH-MSLM model is driven from latest initial conditions of SIE by ensemble of white noise realizations to provide probabilistic regional Arctic forecasts, as well as pan-Arctic ones.
NMEFC (Li and Li), 4.69, Statistical. We predict the September monthly average sea ice extent of Arctic by statistic method and based on monthly sea ice concentration and extent from National Snow and Ice Data Center. The result shows that the Sep. ice extent will be less slightly in 2017 than in 2016.
UTokyo (Kimura et al.,) 4.71, Statistical. Arctic sea-ice cover is predicted from coming July 1 to November 1, using the data from satellite microwave sensors, AMSR-E (2002/03-2010/11) and AMSR2 (2012/13-2016/17). The analysis method is based on our recent research (Kimura et al., 2013). First, we expect the ice thickness distribution in April 30 from redistribution (divergence/convergence) of sea ice during December and April, based on the daily ice velocity data. Then, we predict the summer ice area depending on the assumption that thick ice remains later and thin ice melts sooner than the average.
NSIDC-Slater Probabilistic Ice Extent (Slater et al.), 4.74, Statistical. This is a non-parametric statistical model of Arctic sea ice extent. The model computes the probability of whether ice concentration greater than 15% will exist at a particular location for a particular lead time into the future, given current ice concentration. The only input is sea ice concentration. Probabilities are computed using data from the past 10 years. These probabilities are adjusted using daily near-real-time concentrations to make a forecast. Pan-Arctic Ice extent is the sum of the product of grid-box area the probability of a grid-box containing ice on the forecast date.
Petty (NASA-GSFC), 4.81 +/- 0.34, Statistical. In this forecast we use sea ice concentration (SIC) data (1979-present day), derived from passive microwave brightness temperature using the NASA Team algorithm. The SIC data are detrended spatially using linear trend persistence (from the given forecast year) then averaged, to generate a detrended SIC dataset. A least-squares linear regression model is fit from the mean detrended SIC/SIE data. To produce the SIE forecast, the relevant monthly mean/detrended SIC data are applied to the linear regression model. See my website (http://alekpetty.com/blog/2017ArcticForecasts) for more details.
Kauker et al. (AWI Consortium), 4.82 +/- 0.37, Dynamical Model. For the present outlook the coupled ice-ocean model NAOSIM has been forced with atmospheric surface data from January 1948 to May 29th 2017 (combination of NCEP/NCAR and NCEP-CFSR and NCEP CFSv2). All ensemble model experiments have been started from the same initial conditions on May 29th 2017. The model setup has not changed with respect to the last year. We used atmospheric forcing data from each of the years 2007 to 2016 for the ensemble prediction and thus obtain 10 different realizations of potential sea ice evolution for the summer of 2017. The use of an ensemble allows to estimate probabilities of sea-ice extent predictions for September 2017. A variational assimilation system around NAOSIM has been used to initialize the model using the Alfred Wegener Institute's CryoSat-2 ice thickness product, the University of Bremen's snow depth product, and the OSI SAF ice concentration and sea-surface temperature products. Observations from March and April were used. A bias correction scheme for the CryoSat-2 ice thickness that employs a spatially variable scaling factor could enhance the skill considerably (Kauker et al, 2015, http://www.the-cryosphere-discuss.net/tc-2015-171/).
Meier (NASA Goddard),4.82 +/- 0.7, Statistical. This method is a simple statistical method that uses previous years' daily rates of extent change to project the 2017 daily extent through the end of September. The monthly average is then calculated from the September daily extents. This year, the last twelve years (2005 – 2016) are used for the projection because these years are more representative of recent conditions than using all years in the 38-year time series. There isn't much expected skill at this point because of the large range of extent loss rates that may still occur. However, it provides a reasonable envelop of physically realistic September extents. As September approaches, the "window" of possible extents narrows and hones in on the final observed extent. An updated projection will plan to be submitted in July, using 2017 extent data through 30 June.
CPOM (Schroeder et al.), 5.0 +/- 0.5, Statistical. This is a statistical prediction based on the correlation between the ice area covered by melt-ponds in May and ice extent in September. The melt pond area is derived from a simulation with the sea ice model CICE in which we incorporated a physically based melt-pond model1. See our publication in Nature Climate Change http://www.nature.com/nclimate/journal/v4/n5/full/nclimate2203.html for details2.
NASA GMAO (Cullather et al.), 5.3 +/- 0.33, Dynamical Model. The GMAO seasonal forecast is produced from coupled model integrations that are initialized every five days, with seven additional ensemble members generated by coupled model breeding and initialized on the date closest to the beginning of the month. The main components of the AOGCM are the GEOS-5 atmospheric model, the MOM4 ocean model, and CICE sea ice model. Forecast fields were re-gridded to the passive microwave grid for averaging.
Rob Dekker, 5.4 +/- 0.46, Statistical. Using linear regression of a formula that includes 'land snow cover', ice 'area' and ice concentration as variables, regressed over the 1992-2015 period.
Navy Earth System Model (Metzger et al.), 6.0, Dynamical Model. Forecasts were initialized from the pre-operational US Navy Global Ocean Forecasting System (GOFS) 3.1 for the ocean and sea ice using the Navy Coupled Ocean Data Assimilation (NCODA) system. Atmospheric initial conditions were from the operational NAVy Global Environmental Model (NAVGEM) using the Naval Research Laboratory Atmospheric Variational Data Assimilation System (NAVDAS-AR). Eleven ensemble members were completed using a time-lagged approach. Model forecasts started at 12Z for the following days: May 3, 4, 6, 7, 9, 10, 12, 13, 15, 18 and 20. Each ensemble member was integrated through the end of September 2017.
Full regional, Antarctic, and informal Outlooks are provided below.
Individual Outlook PDFs
| Attachment | Size |
|---|---|
| Barthelemy et al.14.34 KB | 14.34 KB |
| Bosse13.65 KB | 13.65 KB |
| Brettschneider et al.13.66 KB | 13.66 KB |
| Bushuk et al.15.66 KB | 15.66 KB |
| Cavallo et al.13.69 KB | 13.69 KB |
| Cawley13.1 KB | 13.1 KB |
| Chevallier14.14 KB | 14.14 KB |
| Tivy CIS546.01 KB | 546.01 KB |
| CPOM13.63 KB | 13.63 KB |
| Dekker13.11 KB | 13.11 KB |
| FIO-ESM13.49 KB | 13.49 KB |
| Ionita & Grosfeld13.74 KB | 13.74 KB |
| Kaleschke12.85 KB | 12.85 KB |
| Kamal et al.14.19 KB | 14.19 KB |
| Kauker et al.14.27 KB | 14.27 KB |
| Kay et al.13.44 KB | 13.44 KB |
| Kondrashov13.63 KB | 13.63 KB |
| NMEFC (Li and Li)467.63 KB | 467.63 KB |
| Meier14.12 KB | 14.12 KB |
| Met Office14.44 KB | 14.44 KB |
| Modified CanSIPS16.75 KB | 16.75 KB |
| Morison13.61 KB | 13.61 KB |
| NASA GMAO14.1 KB | 14.1 KB |
| Navy Earth System14.42 KB | 14.42 KB |
| Petty (NASA-GSFC)15.02 KB | 15.02 KB |
| Sanwa school13.31 KB | 13.31 KB |
| Slater et al.14.05 KB | 14.05 KB |
| Sun13.29 KB | 13.29 KB |
| Tremblay et al.14.07 KB | 14.07 KB |
| UTokyo13.95 KB | 13.95 KB |
| Wang et al.14.86 KB | 14.86 KB |
| Wu13.74 KB | 13.74 KB |
| Zhang & Schweiger14 KB | 14 KB |
| Met Office - Antarctic Outlook14.42 KB | 14.42 KB |
| Dr. Laura Davies - Antarctic Outlook12.77 KB | 12.77 KB |
| Gudmandsen - Regional Contribution524.76 KB | 524.76 KB |
| Viddal - Informal Contribution48.23 KB | 48.23 KB |
| Druckenmiller and Eicken - Regional Contribution, Bering-Chukchi-Beaufort Seas3.17 MB | 3.17 MB |


