
The Summary Report provides an initial retrospective review of the 2008 Sea Ice Outlook. The report is based on statements from contributors to the 2008 Sea Ice Outlook, and discusses preliminary analyses of the causes of the 2008 minimum, the accuracy of the Outlook values, and implications for future Outlook efforts. Key highlights from the full Summary Report are available below.
Summer 2008 Sea Ice and Meteorological Conditions
The 2008 arctic summer sea ice extent minimum nearly matched the drastic reduction in minimum extent observed in 2007. September 2008 sea ice extent was driven by pre-existing conditions at the end of spring, as well as variable wind patterns over the summer.
How Well Did the Outlook Projections Compare to September Observations?
There was good agreement between outlook projections and observations. The median projected September ice extent from the July Outlook monthly report was 4.9 million square kilometers; the observed value was 4.7 million square kilometers. The 2008 Sea Ice Outlook provided a successful forum for community synthesis and an important first step toward better understanding arctic sea ice loss.
Some Implications for the Future of Arctic Sea Ice Based on the 2008 Outlook
Information about future summer arctic sea ice conditions based on 2008 data is inconclusive. Preliminary interpretation of data and models suggest, however, that we may remain near current conditions until another warm year causes rapid sea ice loss.
Lessons Learned from the 2008 Outlook
A central lesson learned from the 2008 Outlook was that the condition of sea ice in late spring was the major driver of the 2008 sea ice minimum. The Outlook also underscored important lessons for improvements in future efforts, including: a need for additional work on remote sensing of spring and summer sea ice conditions; sea ice thickness data; and more formal forecasting and evaluation methods.
Upcoming Activities
A series of follow-up activities are planned for this fall and winter in order to complete a thorough retrospective analysis of the 2008 season and to plan for a 2009 Sea Ice Outlook effort. The final retrospective report will be completed in early 2009.
Status
On 15 September 2008, a request was sent to the contributors of the 2008 Arctic Sea Ice Outlook to summarize the 2008 arctic sea ice season, with a 25 September return date. A key question to be addressed was: How important were initial conditions of the sea ice at the end of spring versus anomalous summer meteorological forcing in driving the second sequential major September sea ice minimum? This report is based on 20 individual or group responses.
Approach and Disclaimer
The Sea Ice Outlook provides a forum for researchers to evaluate their understanding of the state of arctic sea ice and for the community to jointly assess a range of factors that contribute to arctic summer sea ice minima. The Sea Ice Outlook is not a formal consensus forecast or prediction for arctic sea ice extent, nor is it intended as a replacement for existing efforts or centers with operational responsibility.
Summary
The arctic summer sea ice extent minimum in September 2008 almost matched the drastic reduction in minimum extent observed in 2007. Both these years differ strongly from the summer ice distribution of the 1980s or even the previous record minimum in 2005. The main difference between these two years was the presence of more extensive sea ice in the Siberian Arctic sector from 120°E to 180°E in 2008 (Fig. 1).
2008 Minimum Sea Ice Extent
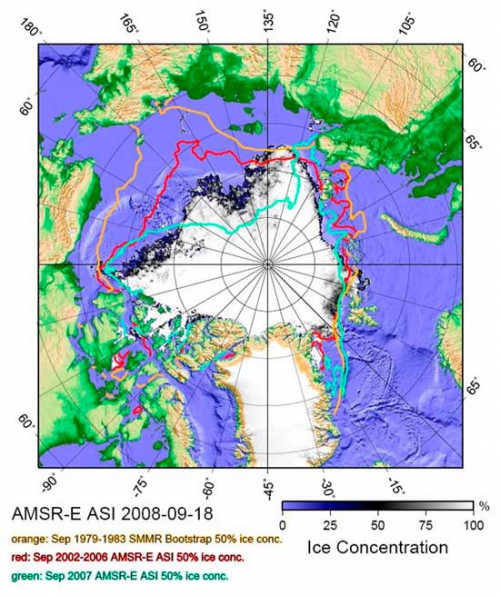
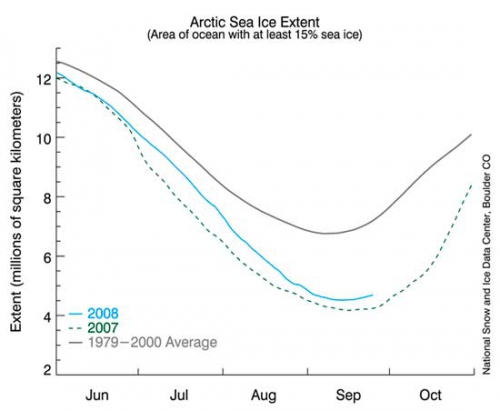
The projections of the Sea Ice Outlook groups for the September 2008 mean minimum ice extent, based on May data, had a median value of 4.2 million square kilometers. This value is roughly the same as that observed in 2007 (monthly average of 4.3 million square kilometers) and somewhat lower than the monthly averaged value of 4.7 million square kilometers observed in 2008 (as provided by W. Meier, NSIDC). With observations from early summer, the projected median ice extent value increased to 4.9 million square kilometers for the July Outlook. Both these Outlook projections are substantially lower and nearer to the observed September 2008 monthly average value than to the 1979–2000 mean value (7.1 million square kilometers) or to the linear trend line of previous September minima (5.6 million square kilometers). Both sea ice models and seasonal melting projections provided the main semi-quantitative information for the Outlook.
This good agreement between projections and observations is consistent with the conclusion that initial conditions of spring sea ice are often an important factor in determining ice development over the course of the summer. The role of summer atmospheric forcing is important, but less so in 2008 compared to 2007. This result bodes well for future seasonal sea ice Outlooks. The latter finding suggests that during the next few summers it will be important to track potential recovery or further decline of the summer ice pack with late spring/early summer satellite and in situ observations providing important information.
Summer 2008 Sea Ice and Meteorological Conditions
Different timing of summer sea ice loss is apparent in daily time series of sea ice extent, which show that the most rapid sea ice loss in 2007 was in late June–early July, while in 2008 it was in August (Fig. 2).
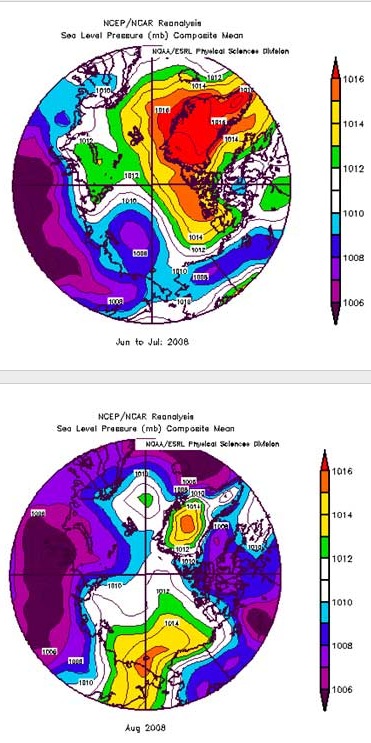
With regard to summer meteorological forcing, 2007 was dominated by a strong dipole pattern in sea level pressure (SLP), with high pressure over the Beaufort Sea and winds blowing from the Bering Strait across the North Pole, promoting both advection of warm air and compaction of the ice pack. In contrast, 2008 SLP patterns changed, with offshore flow from Alaska–opening up the Beaufort Sea–during early summer, rapidly shifting to offshore flow from Siberia in early August, initiating rapid melt in that sector (Fig. 3).
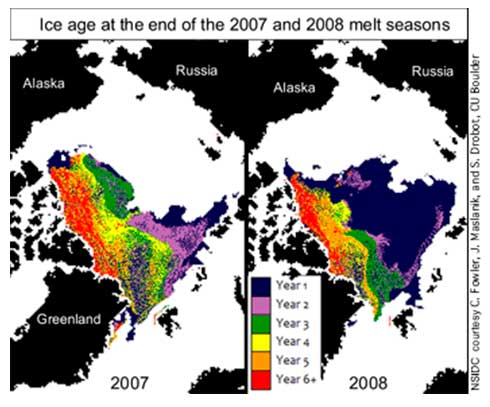
A key question was whether sea ice grown during the winter of 2008 in regions that were free of ice in September 2007 would last through the summer. No clear answer emerges; much sea ice melted out, but a considerable amount of first-year sea ice remained, which will transition into second-year ice during the coming winter (Fig. 4).
How Well Did the Outlook Based on May and July Data Compare to September Observations?
The May Outlook responses had a median value of 4.2 million square kilometers, with a median of 4.9 million square kilometers for the July Outlook (Fig. 5); these compare to a 2008 September observed value of 4.7 million square kilometers. Both Outlook estimates are well below the 1979-2000 mean and below the linear trend line.
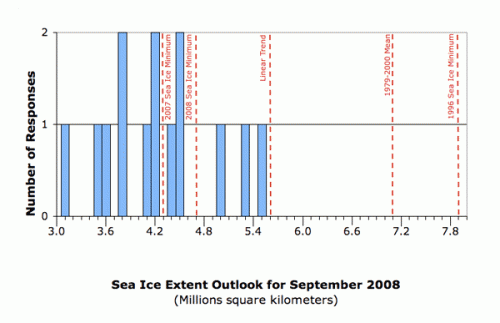
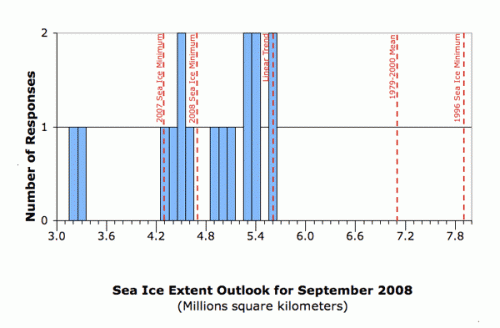
We provide the following argument that the Outlook process has some skill in addition to providing a forum for synthesis of observations and modeling or discussion of processes, as noted by several respondents. In years such as 2008, initial sea ice conditions at the end of spring may have more of an influence on a September arctic sea ice extent Outlook than a forecast of summer wind fields, which dominated the ice situation in 2007. As suggested by the SLP analyses above, in 2008 winds came from different directions in different months, in contrast to the more unidirectional flow in 2007. Most years are more like 2008 where the total atmospheric seasonal forcing on sea ice is the summation of several distinct weather patterns. This logic forms the foundation of the methods that were used by the participants providing semi-quantitative, ice model-based, or seasonal melting projections. These contributors either used an ice model with a group of ensemble wind patterns or they applied a summer melt rate to different initial sea ice thickness categories. A review of the modeling exercise by Zhang from the first May Outlook is helpful (Fig. 6).
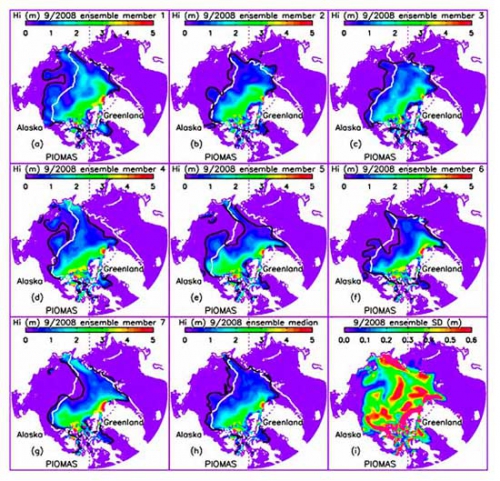
Zhang started his multiple projections for September 2008 from May 1, using hindcast winds from 2001 to 2007. The white line is the observed 2007 minimum sea ice extent. In forcing the model with these winds, only the case of using winds from 2007 to project 2008 sea ice extent produce less sea ice than the observed 2007 ice extent (Ensemble member 7). Other years show regional variability, but all have about the same total extent. We conclude that 6 out of 7 wind years gave about the same answer. The low sea ice minima projected for 2008, relative to the long term mean, were mostly a result of the initial conditions.
Some Implications for the Future of Arctic Sea Ice Based on the 2008 Outlook
Information about future summer arctic sea ice conditions based on 2008 data is equivocal. Both 2007 and 2008 qualify as major outliers compared to previous summer minimum sea ice extents over the last three decades. 2008 was an extreme minimum even though summer 2008 was not an unusual year in terms of meteorological forcing. There has been a continued loss of multiyear sea ice. Rigor estimates, based on buoy drift and modeling, that for March sea ice area, 65% was multiyear before 1990, but multiyear made up only 40% in March 2007 and 27% in March 2008. This is also consistent with Maslanik and co-workers' analysis of satellite-derived ice velocity fields (Fig. 4). One analog for the future comes from the work of Holland and Bitz using the NCAR climate model. Below are several projection ensembles for future minimum summer sea ice extent (Fig. 7).
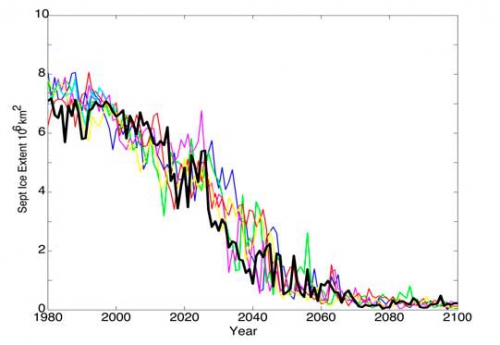
Noting the black line ensemble member, there is a single year event that dramatically reduces the sea ice extent, similar to what was observed in 2007. This is followed by several years of variability around the 4 million square kilometers level, until another dramatic reduction event takes place. This analog implies that it is difficult for arctic sea ice to return to previous sea ice extents of the 1980s. In contrast, sea ice in 2008 (Fig. 4) has a slightly greater extent than 2007 and not all first-year sea ice that formed in winter 2008 melted out during the summer, providing a basis for forming second-year sea ice during winter 2009 and beyond. The work of Perovich (Geophys. Res. Lett. Nov 2007) and the comment of Meier et al. (below) point out that at far northern latitudes, the surface receives less solar radiation over the summer season compared with the Beaufort Sea. Changes in the amount and type of snow deposition on the sea ice is another potential factor. Perhaps if future warm years are rare, multiyear sea ice could slowly rebuild.
As demonstrated by the 2008 Arctic Sea Ice Outlook, and discussed in the more detailed assessments from individual outlook participants provided below, it will require an improved combination of remote sensing and ground-based observations to help constrain and inform future Outlooks and model projections.
Lessons Learned From the 2008 Outlook
- September 2008 sea ice extent was driven by preexisting conditions at the end of spring, as well as variable wind patterns over the summer. 2007 may be an anomalous year where steady meteorological conditions dominated. This supports the conclusion that future Outlooks have some skill, although variable winds late in the season may influence final compactness of the ice pack.
- Buoys provide key observations for mapping and attributing summer ice loss: drift, bottom vs. top melt, amount of snow accumulation, nature of ponds (even if anecdotal from web cams), and thickness of level ice.
- Because of the importance of initial conditions for the sea ice state, more work is needed on remote sensing retrieval and interpretation of spring and summer ice concentrations and ice condition, even if the present operational algorithms are not changed.
- Both full sea ice models and seasonal melting projections applied to detailed sea ice distributions and trajectories provided the main semi-quantitative information for the Outlook.
- Considerable effort should be made to estimate thickness distributions of ice and snow cover needed to initialize simulations.
- Rapid ice drift is an important factor in regional ice conditions, especially redistribution of multiyear ice into areas with high melt rates at low latitudes. Regional scales are critical and we may want to engage additional contributors to expand this element in the future.
- Melt-out of sea ice near the pole may be more difficult than in the Beaufort and Siberian sectors because of the decreasing importance of solar forcing.
How can snow, ice dynamics, summer weather, and melt processes contribute to the recovery of sea ice in ways not well represented in climate models? - Probabilistic forecasting, measures of uncertainty, and more formal evaluation methods need to be evaluated in more depth in future efforts.
- The Outlook process confirmed that 2007 and 2008 were unusual compared to 1980s–1990s conditions and that it will likely be difficult for the Arctic to return to these previous conditions in the near future. Preliminary interpretation of data and models suggest that we may remain near current conditions until another warm year takes place to provide another rapid area loss.
Summaries of Statements Provided by Outlook Participants on the Summer 2008 Sea Ice Season:
Full Contributions can be accessed at the bottom of this report.
Prinsenberg. The ice extent does not tell the complete story. In 2008 we lost more arctic ice and more of the thicker ice beyond 2007. Most of the ice shelves along the northern coast of the Canadian Arctic Archipelago are gone. [16]
Hori. Summer cloudiness over the Arctic Ocean in 2008 was relatively high compared with the anomalously low cloudiness seen in 2007. On the other hand, the fraction of multi-year ice was smaller in the spring of 2008 than in 2007. The latter thinning of sea ice seems to promote the unexpected melting of sea ice seen in this August to September.
Kwok. This past winter and summer was cooler than the year before. In addition, even though the seasonal ice cover was formed later in the fall of 2007, the mean thickness of the seasonal ice cover at the end of March was comparable to that of the previous two seasons. This can be attributed to the shallower snow depth (only slightly more than half of previous year) leading to faster growth, i.e., higher ice production. This allowed the seasonal ice to survive the summer of 2008. So we expect some replenishment of the multiyear ice area this summer.
Howell, Duguay. The Western Parry Channel region of the Northwest Passage did not open this year because it was subject to import of multi-year ice (MYI) from the Queen Elizabeth Islands. This was the fundamental difference between 2007 and 2008. Considerable amounts of MYI have since been flushed into this region of the Northwest Passage, which may make its clearing difficult in 2009. One facet that continued in 2008, however, was the lack of first-year ice (FYI) surviving the melt season within the region.
Stern. It appears that year-to-year persistence has an effect—September 2008 was low partly because September 2007 was low. The factors that lined up to create the September 2007 minimum did not all line up again in September 2008 (winds in particular), hence the slight upward bounce from 2007 to 2008. Note that we have still never had 2 record minima in consecutive years. Some skill in predictability is possible based on the sea ice thickness distribution in spring. To make use of that potential we would need good estimates of sea ice thickness, such as might be obtained from ICESat or CryoSat (i.e., complete spatial coverage).
Lindsay. Our method uses estimates of ice thickness from a coupled ice-ocean model as predictors for a statistical forecast of the minimum ice extent in September. The predictions from both G1 and G2 (area with less than 0.66 m thick ice and area with less than 1.94 m thick ice) were correct to nearly within the error bars every month. As the September ice extent and ice thickness decrease, they will be more subject to variable and unpredictable wind patterns earlier in the season, making the total ice extent more difficult to predict. The 2008 observations reinforce our contention that the record minimum of 2007 was less just the damage left by a perfect storm of unusual winds, but more the result of a gradual erosion of the mean sea ice thickness over the past 20 years and the increasing abundance of thin young ice at the beginning of the melt season.
Maslanik, Drobot, Fowler. Our opinion is that preconditioning was the key factor driving the ice reduction this summer. Our relatively accurate forecasts, which make use of ice age and ice type, demonstrate skill. The key parameters to improve the forecasts are ice thickness and snow depth, generated from observations and/or models. We also feel that increased use of probabilistic forecasting would be useful.
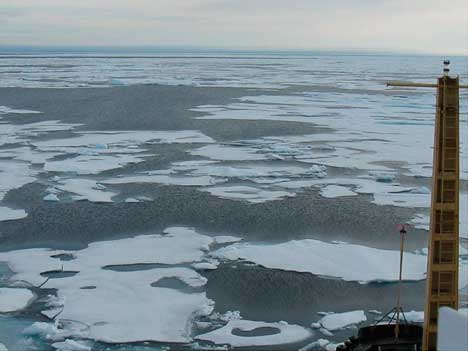
Hutchings. 2008 saw the lowest ever ice extent in the Beaufort Sea. Alice Orlich on the Louis St. Laurent, in July and August 2008, observed a heavily melted ice pack up to 83N (Fig. 8) along 150W (the farthest north the ship achieved this summer). The preconditioning of the ice pack in the previous winter, and the 10 years prior, probably played a role in this event. The Beaufort ice pack has been getting younger, and therefore thinner, since the 1990s. A shift in the Beaufort Gyre towards less recirculation of ice within the Arctic Basin is partly responsible for the younger pack in the southern and western Beaufort Sea. A goal for accurate summer forecasts should be an accurate map of ice type, age, thickness distribution, and ridging at the end of winter.
Miles. The predominantly first-year ice that comprised the ice cover preconditioned it to be more vulnerable to melt through the summer, even in August when the major radiative/thermodynamic effects are generally less than in June and July. The atmospheric patterns were less conducive to melt and (apparently) ice export than in 2007, so a new record was averted. The preconditioning and the state of ice cover in spring is clearly useful for prediction, even if we can't predict the weather patterns. However, it appears that slightly more of this first-year ice managed to survive than would be predicted solely on survival rates based on previous years, so more can be done here.
Meier, Serreze, Stroeve. The summer 2008 melt season offered several surprises. By the end of July, the 2008 extent was well above that for 2007, though still far below normal. However, while August is generally a time when the decline rate begins to slow in response to decreasing solar radiation, this year the extent decline actually accelerated. In examining ice area–the extent weighted by concentration–the seasonal minimum in 2008 was nearly identical to that of 2007. The 2008 melt season ended with a large amount of first-year ice remaining. This was due to cooler conditions, as well as the fact that so much first-year ice was found at far northern latitudes where, compared to lower latitudes, the surface receives less solar radiation over the summer season. This may result in a stabilization of the ice extent for a few years. Regardless, with a growing radiative forcing, an eventual transition to ice-free summers seems inevitable.
http://nsidc.org/news/press/20081002_seaice_pressrelease.html
Kaleschke. The preconditioning–very likely, a thinner sea ice cover–was the reason for the false statistical prediction of the sea ice minimum. The last two years clearly fall out of the statistical cluster of the years before. The anomalous rapid retreat of the ice area in August could not be explained by the summer—nor by the wintertime atmospheric forcing. In September 2008, the sea ice area minimum was less than 5% larger than the September 2007 sea ice area minimum as derived from AMSR-E 89 GHz data. The absolute difference is so small that only a few days with different forcing could have put 2008 for another record. Passive microwave observations of the sea ice area are well validated and reliable. The largest uncertainties arise from the melted ice surface and research should be prompted in the investigation and quantification of this error source. The greatest unknown is sea ice thickness. More ice mass balance buoys should be deployed and extensive EM measurements should be conducted. The new satellite altimeter systems such as ICESAT and CRYOSAT offer the possibility of ice thickness measurement from space. The development of a fully coupled ocean-ice-atmosphere prediction system is a key issue for a better Outlook and for climate predictions on a decadal time scale. The problem of the initialization is only one of the fundamental challenges towards such a system. Animation of sea ice satellite measurements 1992-2008 including a virtual flight over the northern sea route available at: ftp://ftp-projects.zmaw.de/seaice/outreach/Seaice_SSMI_EN_19911205_2008…
Zhang. Preconditioning and anomalous meteorological forcing are all important. The ensemble predictions demonstrate certain skills in estimating both ice extent and its shape, in comparison with observations. However, they do not show improved accuracy with decreasing prediction range. Assimilation of satellite ice concentration improves the predictions. Although summer 2008 has slightly larger sea ice extent than summer 2007, the ice is thinner in a large area in the western Arctic, according to PIOMAS model/data assimilation (http://psc.apl.washington.edu/zhang/IDAO/summer2007_2008_arctic_seaice…). Summer 2008, though having a larger ice extent, has less ice than summer 2007. Mean September 2008 ice volume is 5900 cubic kilometers, actually lower than September 2007 ice volume at 6000 cubic kilometers. So we would probably have another summer ice low next year, if not setting a new record.
Eicken. In the Alaska Arctic sector (Bering, Chukchi and Beaufort Sea), ice retreat in the summer of 2008 progressed somewhat less rapidly over the months of June and July than in 2007, although ice retreat late in the season rivaled or exceeded that of 2007. A key difference for local communities and marine mammals was that ice lingered much longer in coastal regions and over the Chukchi shelf, allowing hunters access to walrus and seals, while in turn allowing walrus to feed off the ice platform. 2008 demonstrated that despite the preconditioning of 2007, high rates of advection still allowed for multiyear ice to persist in the Alaskan Arctic in early spring and summer. What is needed is a more systematic way of integrating data on the thickness distribution of this ice into models that forecast regional ice conditions and their impact on ice ocean interaction. Comparison with ground-based observations by Iñupiat ice experts demonstrates that standard remote-sensing products are not always useful in helping assess or predict the conditions at the local level. Pond formation and small floe sizes in dispersed ice (and coastal effects on the radiometer signal) contribute to substantial biases in the derived ice concentration data.
Gascard. Although the past winter was significantly colder than the previous winter, and more ice was formed and summer was not as long as the previous summer, it looked like the 2008 summer minimum sea ice extent would get pretty close to the previous minimum reached last year with some differences notably in the western Arctic (Chukchi and Beaufort Seas). For most of the summer there was a persistent tongue of ice in the Chukchi Sea (north of Wrangel Island) that finally disappeared at a later stage. Even if the 2008 summer sea ice minimum extent appeared to be slightly above the 2007 all-time record minimum, according to passive radiometers, it does not seem like the ice mass budget is significantly different in 2008 compared with 2007. The lower sea ice concentration observed north of the Beaufort Sea in the area and explored during CHINARE 2008 with Xuelong seems to have been preconditioned by a strong and persistent northward sea ice drift that lasted for several months from spring (April 2008), when ice stations were deployed north of the Canadian polar station Eureka, to well into the summer. Very early in the season this whole area already exhibited a significantly lower sea ice concentration that accentuated throughout the summer season. It seems like sea ice drift speed is an important parameter related to sea ice summer minimum extent and that seems quite logical. Why is sea ice drifting so much more rapidly today than before?
Pokrovsky. When comparing summer SST fields for 2007 and 2008 one can see that there was a stronger positive anomaly in 2008's North-Western Pacific SST and stronger negative one in 2007's North-Eastern Pacific SST. In contrast, the 2008's Nordic Seas were colder than 2007's field, as well as all Russian margin seas. As a result, in 2007 one can observe northward inflow of warm air to the Eastern Arctic through the Russian Far East area, and in 2008, similar inflow via high latitude domain of North America. Thus, the most free of ice areas at this September are located in Chukchi and Beaufort Seas, but in 2007 those were in the Russian sector of the Arctic. The Atlantic sector of the Arctic was more ice covered, as it was impacted by more cold incoming Atlantic water in 2008 with account to those for 2007. Lower SLP in summer 2007 was a causal of more intensive transport of warm Atlantic water during last summer, which impacted more intensive ice melting in the Kara and Barents Seas. That was a major motivation to predict a significant positive shift in arctic ice extent for this September.
Pedersen, Dybkjaer, Tonboe. The main preconditioning considered in our outlook is the area of robust multiyear ice in spring (April-May), the thickness of the FY ice as determined by the number of freezing degree days during winter/spring and the spring/summer total ice extent at the time of issue of the outlook. The number of North Pole freezing degree days was larger in 2008 than 2007. A smaller multiyear ice area in the Arctic Ocean means that the sea ice summer extent is more sensitive to weather conditions during summer and thus more difficult to predict using statistical regression analysis since seasonal weather forecasts are not reliable. In the spring 2008 it looked like another minimum extent record with very high retreat rates and our first prediction in May (3.66 million square kilometers) and second in June (3.41 million square kilometers) were below the 2007minimum. Our third prediction in July (4.46 million square kilometers) when the summer melt had started was about the same as last year and quite close to the actual 2008 extent (4.52 million square kilometers).
Rigor, Clemente-Colón, Nghiem, Brinkley, Arbetter. Although we did not set a new record minimum as we expected, the ice did retreat considerably in the Beaufort, Chukchi, East Siberian, and Laptev seas as we expected, despite what may have been a cooler summer than 2007, and the fact that the winds during summer tended to export less sea ice from the Arctic Ocean. In retrospect, our overall outlook of setting a new record minimum based on the vast amount of FY ice should have been tempered by the fact that the FY ice over the pole should be thicker since it was the first ice to grow last fall and the north pole is also colder than the Eurasian and Alaskan coasts, and during summer this ice is subject to less incident sunlight.
Arbetter, Helfrich, Clemente-Colón, Rigor. Because much of the ice in the Arctic was first-year ice, it was expected to melt more readily. In a typical year, most first-year ice does not survive the summer, while the multiyear, or perennial ice, remains intact. But 2008 was far from typical. The fact that the ice extent did stay above the all-time record low is due to weakened transport and average or lower temperatures over the Canadian side of the basin (where ice is typically thickest). Had a stronger Beaufort Gyre existed, more ice would have been transported out via Fram Strait. If the temperatures had been above average, there would have been more surface melt and heating of the ocean surface layer; this would have accelerated the melt rate of the ice.
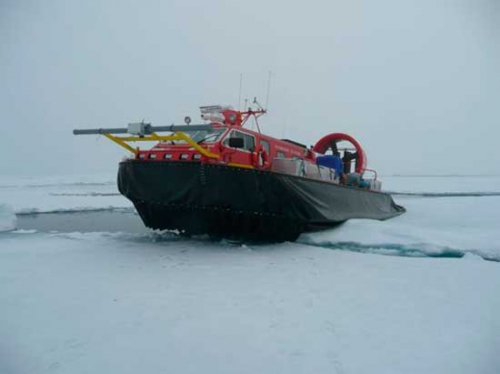
Haas. On an anecdotal side note, I am sorry that I (and Canada...) was not able to provide any more ice thickness data this summer to nail down some of the issues discussed by so many of you. However, it is not that we hadn't at least tried hard to obtain some data. So a team of two from Norway and Canada, supported by another person on land from Israel, set out with a small hovercraft to survey the ice thickness at least in the MIZ north of Svalbard in early September. In fact, we obtained some 100 km or so of thickness data, but its interpretation is pending because ice thickness in the MIZ is subject to variable ice concentration, deformation, and ocean forcing, leading to different degrees of lateral and bottom melt, and thin ice might melt preferentially. However, we found many floes with modal ice thicknesses between 0.9 and 2.0 m, which is similar to or thicker than what was observed last summer even further north. Attached is a photo of the hovercraft with the thickness sensor in the front which shows some of the endeavor. At least it was all good fun!
| Attachment | Size |
|---|---|
| Download All Individual Summary Report Submissions (PDF - 3 MB)3.02 MB | 3.02 MB |
| Attachment | Size |
|---|---|
| Arbetter et al.638.86 KB | 638.86 KB |
| Eicken494.86 KB | 494.86 KB |
| Gascard508.41 KB | 508.41 KB |
| Haas247.71 KB | 247.71 KB |
| Hori495.04 KB | 495.04 KB |
| Howell502.19 KB | 502.19 KB |
| Hutchings567.23 KB | 567.23 KB |
| Kaleschke855.66 KB | 855.66 KB |
| Kwok493.69 KB | 493.69 KB |
| Lindsay722.21 KB | 722.21 KB |
| Maslanik et al.674.89 KB | 674.89 KB |
| Meier et al.499.8 KB | 499.8 KB |
| Miles488.16 KB | 488.16 KB |
| Pederson et al.510.86 KB | 510.86 KB |
| Pokrovsky616.53 KB | 616.53 KB |
| Prinsenberg723.89 KB | 723.89 KB |
| Rigor et al.518.32 KB | 518.32 KB |
| Stern498.25 KB | 498.25 KB |
| Zhang505.34 KB | 505.34 KB |


